Weekly Market Update, September 2, 2014

Presented by Mark Gallagher

General market news
• Equity markets continued to march higher last week, with the S&P 500 and the Dow Jones Industrial Average both hitting all-time highs.
• Starting last week at 2.40 percent, the yield on the 10-year Treasury dropped as low as 2.32 percent late in the week. After the long weekend, the 10-year yield was back up to 2.38 percent early Tuesday morning. We saw a similar but less drastic move on the long bond, with the 30-year Treasury yield starting last week at 3.16 percent, dropping as low as 3.06 percent late in the week, and bouncing back up to 3.13 percent early Tuesday morning.
• The markets will be anticipating the midweek release of the Federal Reserve’s Beige Book report, which summarizes the economic conditions in each district and sector. Wednesday’s report will be followed by speeches from six Fed officials over the next few days and Ben Bernanke next week, leading up to the September 16 Fed meeting.
• As investors return from summer vacation, we expect volume in the equity markets to pick up in the coming weeks, and investors will begin to focus more narrowly on earnings for both the third and fourth quarters.


Equity Index 

Week-to-Date %           Month-to-Date %            Year-to-Date %          12-Month %
S&P 500

0.80%                                 4.00%                                       9.88%                             25.23%
Nasdaq Composite 

0.94%                                   4.99%                                        10.59%                          29.22%
DJIA 

0.63%                                   3.60%                                         4.84%                           18.18%
MSCI EAFE 

0.56%                                  −0.18%                                         3.05%                            17.16%
MSCI Emerging Markets  

0.42%                                    2.20%                                       10.65%                           20.28%
Russell 2000 

1.24%                                    4.96%                                         1.75%                             17.68%
Source: Bloomberg


Fixed Income Index

 Month-to-Date %               Year-to-Date %                 12-Month %
U.S. Broad Market

−0.02%                                       5.02%                                    5.80%
U.S. Treasury 

0.01%                                           4.32%                                     4.15%
U.S. Mortgages 

−0.01%                                        4.25%                                     5.26%
Municipal Bond 

0.01%                                           8.20%                                     11.14%
Source: Bloomberg

What to look forward to
The week will feature data on ISM Manufacturing, which is expected to contract slightly, and Factory Orders, which are expected to increase. We will also see ISM Non-Manufacturing data, which is expected to contract.

The week will end with the August Employment report, with analysts predicting a slight drop in the unemployment rate, from 6.2 percent to 6.1 percent. Gains are anticipated in Nonfarm Payrolls and Average Hourly Earnings.

Disclosures: Certain sections of this commentary contain forward-looking statements that are based on our reasonable expectations, estimates, projections, and assumptions. Forward-looking statements are not guarantees of future performance and involve certain risks and uncertainties, which are difficult to predict. All indices are unmanaged and are not available for direct investment by the public. Past performance is not indicative of future results. The S&P 500 is based on the average performance of the 500 industrial stocks monitored by Standard & Poor’s. The Nasdaq Composite Index measures the performance of all issues listed in the Nasdaq Stock Market, except for rights, warrants, units, and convertible debentures. The Dow Jones Industrial Average is computed by summing the prices of the stocks of 30 large companies and then dividing that total by an adjusted value, one which has been adjusted over the years to account for the effects of stock splits on the prices of the 30 companies. Dividends are reinvested to reflect the actual performance of the underlying securities. The MSCI EAFE Index is a float-adjusted market capitalization index designed to measure developed market equity performance, excluding the U.S. and Canada. The MSCI Emerging Markets Index is a market capitalization-weighted index composed of companies representative of the market structure of 26 emerging market countries in Europe, Latin America, and the Pacific Basin. The Russell 2000® Index measures the performance of the 2,000 smallest companies in the Russell 3000® Index. The Barclays Capital Aggregate Bond Index is an unmanaged market value-weighted performance benchmark for investment-grade fixed-rate debt issues, including government, corporate, asset-backed, and mortgage-backed securities with maturities of at least one year. The U.S. Treasury Index is based on the auctions of U.S. Treasury bills, or on the U.S. Treasury’s daily yield curve. The Barclays Capital Mortgage-Backed Securities (MBS) Index is an unmanaged market value-weighted index of 15- and 30-year fixed-rate securities backed by mortgage pools of the Government National Mortgage Association (GNMA), Federal National Mortgage Association (Fannie Mae), and the Federal Home Loan Mortgage Corporation (FHLMC), and balloon mortgages with fixed-rate coupons. The Barclays Capital Municipal Bond Index includes investment-grade, tax-exempt, and fixed-rate bonds with long-term maturities (greater than 2 years) selected from issues larger than $50 million. The Barclays Capital U.S. Treasury Inflation Protected Securities (TIPS) Index measures the performance of intermediate (1- to 10-year) U.S. TIPS.

###

For IARs: Mark Gallagher is a financial advisor located at Gallagher Financial Services at 2586 East 7th Avenue Suite # 304, North Saint Paul, MN. He offers securities and advisory services as an Investment Adviser Representative of Commonwealth Financial Network®, Member FINRA/SIPC, a Registered Investment Adviser. He can be reached at 651-774-8759 or at mark@markgallagher.com.

Authored by the Investment Research team at Commonwealth Financial Network.

© 2014 Commonwealth Financial Network®
Market Update for the Month Ending August 31, 2014

Presented by Mark Gallagher

U.S. markets shoot higher
August was another very strong month for U.S. stock markets, even as the conflict in Ukraine worsened and signs of weaker global economic growth appeared. After a slow first week, gains were steady through month-end, with the S&P 500 Index closing out August up 4 percent, the Dow Jones Industrial Average up 3.6 percent, and the Nasdaq up 4.82 percent. The larger uptick for the Nasdaq suggests that investors were becoming more focused on gains than on market risks.

Fundamentals continued to strengthen from July’s already strong levels. With 99 percent of companies reporting by the end of August, per FactSet, almost three-quarters had beaten earnings expectations, while almost two-thirds had beaten sales estimates. The overall earnings growth rate was 7.7 percent, up a full percentage point from the end of July. The earnings surprise level was consistent with past quarters, but the sales surprise level was much higher, suggesting that companies are actually strengthening their performance as the domestic economic recovery continues. Investors reacted to the improving financial picture by bidding stock prices higher.

Technicals remained strong at month-end, following a strong bounce off of moving-average support levels early in the month. The Dow bounced off of its 200-day moving average, while the S&P 500 recovered from its 100-day and the Nasdaq from its 50-day. All are now above their support levels. With the averages at or close to recent highs, there is little resistance to slow further appreciation.

While the U.S. recovery supported domestic market growth in August, developed international markets suffered from political and economic problems, and the MSCI EAFE Index posted a 0.15-percent decline. Just as with the U.S. indices, the EAFE was down at the beginning of the month and then recovered, but its recovery was limited by news that European growth continued to be much weaker than expected, as well as by the continuing and expanding conflict in Ukraine. At month-end, reports of actual Russian troop presence in Ukraine raised the possibility of more comprehensive sanctions and a wider war, which could damage European economies even more. Technically, developed foreign markets continued to be weak, with the recovery during the month failing to lift them above support levels.

On the other hand, emerging markets, as represented by the MSCI Emerging Markets Index, had a positive month, gaining 2.07 percent in August. Possible reasons included the growing likelihood of quantitative easing by the European Central Bank (ECB) and renewed growth in China. Emerging markets have typically performed well when developed central banks loosen policy, and this looks likely to continue. Technical signs for emerging markets are positive and improving.

Fixed income also showed gains for the month, as rates declined. The 10-year Treasury rate continued to drop from the already low levels at July’s end, finishing August at 2.35 percent, down 23 basis points. Lower rates mean higher bond prices, and the Barclays Capital Aggregate Bond Index gained 1.10 percent in August. The decline in rates in the U.S. appeared largely due to a flight to safety by investors spooked by the situation in Ukraine and supported by continued ECB monetary easing.

August revisions show U.S. economy growing even faster
Economic reports in August continued strong but showed pockets of slowing that suggest caution. Good news included consumer confidence recovering to a seven-year high—the highest level since the financial crisis. Business confidence went along for the ride, with the major survey of the service sector reaching an eight-year high. Housing starts rebounded sharply after weakness in July, while prices continued to increase as mortgage foreclosures and delinquencies dropped even further, settling at close to normal levels for the first time since the financial crisis.

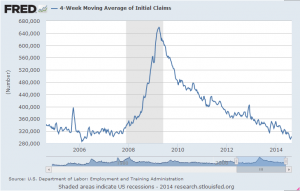
Employment growth continued strong. Initial jobless claims remained under the 300,000 level, a sign of strength. Further, the four-week moving average of initial claims remained below the 300,000 level for much of the month, which last occurred before the recession (see chart). The unemployment rate edged up slightly in what, counterintuitively, is also a sign of strength because the recovering economy has lured more people back into the labor market. July’s monthly increase of 209,000 jobs, though down from June, continued a string of 200,000+ months that is the longest since the late 1990s.

Market Update Aug 31

But there were areas of weakness. Personal spending actually declined for the month. This was a surprise and inconsistent with the strong consumer confidence numbers, and it may have led to weaker-than-expected retail sales growth. Spending depends heavily on wage growth, which was flat on the month and continues to defy expectations of an increase. On the business side, industrial production was also disappointing.

The big economic news in August was Janet Yellen’s speech at the Federal Reserve’s (Fed) annual Jackson Hole Economic Policy Symposium. In her remarks, she noted that, overall, the economy was growing faster than the Fed had expected and the labor market was improving more quickly. She cautioned, however, that risks remained and that the Fed intended to continue its stimulative policy bias. In general, this was the most positive speech that a Fed chairman has made in some time, and it suggested that even the Fed expects the recovery to continue.

Overall, the economy remains strong and the recovery appears to be on track. Economic growth for the second quarter was revised up to 4.2 percent from an already very strong 4 percent, and leading indicators remain strong. But the signs of weakness from the consumer sector suggest a degree of caution looking forward. Unless and until wage growth accelerates, the recovery may not move beyond current levels; however, even with that, growth is likely to continue.

International risks return to the forefront
While the U.S. continued to grow, European growth slowed even further. The German economy, long the engine of what recovery there was in Europe, actually shrank 0.2 percent in the second quarter—not a lot but a harbinger of growing weakness across the continent.

Other European countries also had problems, the biggest of which was the collapse of the French government driven by policy conflicts between that country’s economics minister and its president. With both Germany and France showing weakness, the core of the eurozone is subject to much more uncertainty.

Further worsening the situation in Europe is the growing crisis in Ukraine. Although thought to be under control at the end of July, in late August Russian troops moved into eastern Ukraine to support separatists there, even as Ukrainian government troops suffered reverses. European sanctions, which have already hit both the Russian and European economies, may be made more severe, leading to further economic damage.

Though Europe is the primary source of economic risk, other hotspots, like Syria and Iraq because of the ISIS insurgency, continue to simmer. The Israeli/Gaza conflict is also still on the table. Finally, while Chinese growth has recovered, questions about the sustainability of its growth model, as well as its more recent reversion to previous policy models, remain.

A beautiful August could lead to a beautiful fall
After a difficult first half of the year, on multiple levels, the summer has been much better. Both July and August have had much better weather, as well as much better economic news and market results. Fundamentals continue to be very strong—good economic and employment growth, stronger-than-expected corporate sales and earnings growth—suggesting that the sunshine will likely continue.

Even so, we can see the storms forming around the world. Europe remains politically and economically fraught, with the ECB preparing to implement policies that it once categorically ruled out, driven by growing evidence that current policies have failed. Iraq and Syria continue to devolve into warlord-led violence, as does Libya. War also looms as a very real possibility, as Russian troops move into the European borderland of Ukraine and expanded sanctions appear to be very likely at a minimum.

Here in the U.S. we have largely benefited from these trends but may not continue to do so if they worsen. Even as the Fed ratifies the U.S. recovery by preparing to end its bond purchases, a crisis in Europe or Asia could easily shock our economy. U.S. markets are priced for the current good news to continue, so any sign that it will not could have a disproportionate effect.

Looking at the big picture, though, the U.S. remains the most politically stable and economically solid of the major economies. Any short-term volatility may rock the boat but no more than that. As always, a properly constructed portfolio can give good returns in good times and a solid framework in bad times, regardless of sunshine or stormy weather.

All information according to Bloomberg, unless stated otherwise.

Disclosure: Certain sections of this commentary contain forward-looking statements that are based on our reasonable expectations, estimates, projections, and assumptions. Forward-looking statements are not guarantees of future performance and involve certain risks and uncertainties, which are difficult to predict. Past performance is not indicative of future results. Diversification does not assure a profit or protect against loss in declining markets. All indices are unmanaged and investors cannot invest directly into an index. The S&P 500 Index is a broad-based measurement of changes in stock market conditions based on the average performance of 500 widely held common stocks. The Dow Jones Industrial Average is a price-weighted average of 30 actively traded blue-chip stocks. The Nasdaq Composite Index measures the performance of all issues listed in the Nasdaq Stock Market, except for rights, warrants, units, and convertible debentures. The MSCI EAFE Index is a float-adjusted market capitalization index designed to measure developed market equity performance, excluding the U.S. and Canada. The MSCI Emerging Markets Index is a market capitalization-weighted index composed of companies representative of the market structure of 26 emerging market countries in Europe, Latin America, and the Pacific Basin. It excludes closed markets and those shares in otherwise free markets that are not purchasable by foreigners. The Barclays Capital Aggregate Bond Index is an unmanaged market value-weighted index representing securities that are SEC-registered, taxable, and dollar-denominated. It covers the U.S. investment-grade fixed-rate bond market, with index components for a combination of the Barclays Capital government and corporate securities, mortgage-backed pass-through securities, and asset-backed securities.

###

For IARs: Mark Gallagher is a financial advisor located at Gallagher Financial Services at 2587 East 7th Avenue Suite #304, North Saint Paul, MN. He offers securities and advisory services as an Investment Adviser Representative of Commonwealth Financial Network®, Member FINRA/SIPC, a Registered Investment Adviser. He can be reached at 651-774-8759 or at mark@markgallagher.com.
Authored by Brad McMillan, vice president, chief investment officer, at Commonwealth Financial Network.

© 2014 Commonwealth Financial Network®