Market Update for the Quarter Ending December 31, 2015

Presented by Mark Gallagher

A disappointing year for financial markets
U.S. markets posted weak results for December and 2015 as a whole, despite solid fourth-quarter gains. The Dow Jones Industrial Average, S&P 500 Index, and Nasdaq were all down in December—1.52 percent, 1.58 percent, and 1.98 percent, respectively. But all were up strongly for the quarter, with the Dow rising 7.70 percent, the S&P 500 gaining 7.04 percent, and the Nasdaq up a robust 8.38 percent.

For the year, the Dow was up 0.21 percent and the S&P 500 gained 1.38 percent. Although the Nasdaq was up 5.73 percent for the year, this result was well below average annual return levels.

International markets underperformed U.S. markets in 2015. The MSCI EAFE Index, which represents developed international markets, was down 1.35 percent for December but up 4.71 percent for the quarter. The MSCI Emerging Markets Index fared worse, down 2.48 percent for December and posting a marginal 0.26-percent quarterly gain. For the year as a whole, developed and emerging markets were down 0.81 percent and 16.96 percent, respectively. In addition, both indices ended the year well below their 200-day moving averages.

Fixed income had a relatively weak 2015. The Barclays Capital U.S. Aggregate Bond Index was down 0.32 percent for December and 0.57 percent for the fourth quarter, which resulted in a gain of only 0.55 percent for the year as a whole. This tepid performance was largely driven by volatility in interest rates throughout 2015.

Economic recovery continues slow but steady
The major economic story for the fourth quarter was the Federal Reserve’s decision to raise target interest rates, signaling that the economy was strong enough to accommodate a move toward normal interest rates.

The service sector—which constitutes roughly seven-eighths of the economy—performed strongly, generating substantial improvement in employment. More than 2.6 million jobs were created in 2015.

At year-end, slow wage growth showed signs of improvement. Although consumer spending growth was slower than wage income growth, savings rates approached previous high levels, suggesting that spending could accelerate.

Low oil prices support continued growth
Most observers had expected oil prices to rebound in 2015, but they remained low. After declining 50 percent from their 2014 peak, prices stabilized in mid-2015 at $55 to $60 per barrel, only to drop in the second half of the year to below $40 per barrel. This volatility is clearly seen in Figure 1.

Figure 1. WTI Crude Spot Prices, January 2014–January 2016
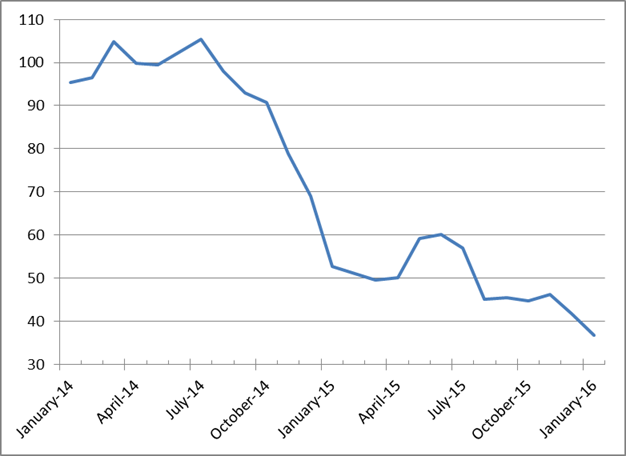
WTI Crude Spot Prices, January 2014–January 2016

Source: Bloomberg

We have no direct evidence of increased consumer spending as a result of lower gas prices, but the fact that auto sales rose to more than 18 million vehicles in 2015 suggests that there has been a positive effect. Lower energy prices also benefit companies, in the form of lower costs, which helps profit margins and potentially stock prices.

Looking ahead, even though the previous oil price decline has worked its way into the economy, most of the more recent decline has not, suggesting that economic growth may continue to accelerate. Lower oil prices will also benefit other countries, especially China, Europe, and Japan. These economies continue to stagnate, and lower energy costs will act as a much-needed stimulus.

U.S. outlook remains good, but there are risks
We begin 2016 with a positive outlook; however, risks remain. China’s growth continues to decline, and Europe and Japan are at risk economically. In the case of Europe, the risks are also political because of the Syrian refugee crisis. Perhaps most worrisome is the Middle East, where ISIS is expanding.

Here in the U.S., there are signs of a slowdown. Corporate fundamentals may be weakening, though stock valuations remain high. Expected earnings growth has been downgraded for 2016, and further downgrades are possible.

These risks notwithstanding, the U.S. economy is solid, trends are good, and we are well positioned to overcome challenges. As always, a long-term perspective and diversified portfolio are the best ways to take advantage of opportunities and overcome risks.

All information according to Bloomberg, unless stated otherwise.

Disclosure: Certain sections of this commentary contain forward-looking statements that are based on our reasonable expectations, estimates, projections, and assumptions. Forward-looking statements are not guarantees of future performance and involve certain risks and uncertainties, which are difficult to predict. Past performance is not indicative of future results. Diversification does not assure a profit or protect against loss in declining markets. All indices are unmanaged and investors cannot invest directly into an index. The Dow Jones Industrial Average is a price-weighted average of 30 actively traded blue-chip stocks. The S&P 500 Index is a broad-based measurement of changes in stock market conditions based on the average performance of 500 widely held common stocks. The Nasdaq Composite Index measures the performance of all issues listed in the Nasdaq Stock Market, except for rights, warrants, units, and convertible debentures. The MSCI EAFE Index is a float-adjusted market capitalization index designed to measure developed market equity performance, excluding the U.S. and Canada. The MSCI Emerging Markets Index is a market capitalization-weighted index composed of companies representative of the market structure of 26 emerging market countries in Europe, Latin America, and the Pacific Basin. It excludes closed markets and those shares in otherwise free markets that are not purchasable by foreigners. The Barclays Capital Aggregate Bond Index is an unmanaged market value-weighted index representing securities that are SEC-registered, taxable, and dollar-denominated. It covers the U.S. investment-grade fixed-rate bond market, with index components for a combination of the Barclays Capital government and corporate securities, mortgage-backed pass-through securities, and asset-backed securities.
Authored by Brad McMillan, senior vice president, chief investment officer, at Commonwealth Financial Network.

© 2016 Commonwealth Financial Network®


Is This the Way the World Ends? A Look at January Market Volatility

Presented by Mark Gallagher

With the recent market declines both abroad and here in the U.S., there is increasing fear that this is it—the big one that will take us back to the depths of 2008. Although that level of fear is certainly understandable, a closer look at the real economic and market situation around the world suggests that the volatility we are now seeing—and that we may well continue to see—is perfectly normal. Indeed, this kind of volatility is why stocks can, over time, yield the returns they do. Which means that these periodic declines are not only normal, but necessary.

This, however, does not really answer the question. How normal is this current decline—and how would we know if we are headed back to 2008? Is there a way to tell?

How normal is this decline?
Let’s start with the easy question first. Right now, we are down about 9 percent from the market peak. Since 1980, declines during a calendar year have ranged between 2 percent and 49 percent, with the average decline at just over 14 percent. So, the market could drop another 5 percent, and we’d still only be at the average decline for a typical year.

Another way to look at this is to see how often a decline of any given size occurs. Markets experience a 10-percent decline every year, on average, and this is only the second we’ve seen in the past three years. In that sense, we are overdue, but how much worse can this get?

How can we tell if we’re headed for another 2008?
There are no guarantees, of course, but if we look at past bear markets (defined as declines of 20 percent or more), we can make some observations.

First, of 10 such events since 1929, 80 percent of them happened during a recession. The U.S. economy, despite some slowing trends, continues to grow; we are not in a recession. A growing economy tends to support market values and limit declines.

Second, 40 percent of past bear markets came during times of rapidly rising commodity prices—the 1973 oil embargo, for example. Rising prices tend to choke off economic activity and slam profit margins. Now, of course, we have low and dropping commodity prices, which encourage economic growth and help profit margins, at least here in the U.S. This is, overall, the opposite of a problem.

Third, during 40 percent of past bear markets, the Federal Reserve (Fed) aggressively raised interest rates. With rates still one step from zero—and likely to stay very low for some time—we again have the opposite conditions from those that fuel a bear market. The Fed continues to add stimulus to the economy, which has supported the market so far, and will continue to do so. Rather than being part of the problem, this Fed is determined to remain part of the solution.

Finally, half of the bear markets were born when market values were extreme. Current valuations are high, but they are nowhere near previous peaks. In fact, although an adjustment to lower valuations is painful, as we are seeing, it also means the risk of a further drop dissipates, which takes us back to the fact that periodic drawdowns are not only necessary, but healthy.

Almost all bear markets have more than one of these traits; right now, we have (at most) one and really more like one-half of one. In fact, for two of these traits, we actually have the opposite of a problem. This doesn’t mean that we won’t see further declines, but it does suggest that they are less likely—and would probably be short-lived.

We can also look at recent history to see how much more trouble we might see if the situation does worsen. In 2011, when Greece almost declared bankruptcy and broke up the European Union, for example, we saw a pullback of 19 percent, which almost met the standards of a bear market. In 1998, during the Asian financial crisis, we also saw a pullback of 19 percent. Despite the headlines, our current international economic situation is nowhere near as bad of either of those years. And even with those declines, the annual return for each year wasn’t disastrous: in 2011, the market ended flat, and in 1998, it actually gained 27 percent.

So, what can we expect in 2016?
It does not seem likely that we will see that kind of gain in 2016, but it also does not seem likely that we will see a massive and sustained decline that takes us back to 2008. Worst case, if the Chinese situation gets as bad as the Asian financial crisis, or the Greek crisis, we could see additional damage, but we probably won’t see anything worse than what occurred during those pullbacks.

With a growing economy, with strong employment and spending growth, and with low oil prices and interest rates, the U.S. is well positioned to ride out any storms. More so, in fact, than we were in 2011. As the island of stability in the world, we are also very attractive to foreign investors—as we can see by the strength of the dollar.

By understanding the history and economic context of today’s turmoil, it is clear that although markets may get worse in the short term, the foundations remain solid, which should lessen the effect and duration of any further damage. Yes, the headlines are very scary, but things actually aren’t that bad. So, we will be postponing the end of the world . . . again.

Forward-looking statements are not guarantees of future performance and involve certain risks and uncertainties, which are difficult to predict. All indices are unmanaged, and investors cannot invest directly in an index. Unlike investments, indices do not incur management fees, charges, or expenses. Past performance is no guarantee of future results.
Mark Gallagher is a financial advisor located at Gallagher Financial Services at 2586 East 7th Ave North Saint Paul, MN 55109. He offers securities and advisory services as an Investment Adviser Representative of Commonwealth Financial Network®, Member FINRA/SIPC, a Registered Investment Adviser. He can be reached at 651-774-8759 or at mark@markgallagher.com.
Authored by Brad McMillan, CFA®, CAIA, MAI, chief investment officer at Commonwealth Financial Network.

© 2016 Commonwealth Financial Network®


Weekly Market Update, January 4, 2016

Presented by Mark Gallagher

General market news
• The 10-year Treasury opened 2016 with a yield of 2.29 percent before promptly dropping to as low as 2.20 percent. The 30-year Treasury also dipped from a 3.03-percent open to 2.95 percent in the first few hours of trading. The short end of the yield curve moved as well, with the 2-year Treasury opening at 1.06 percent before dropping to 1.02 percent.
• Global equity markets were a bit volatile last week.
• In the U.S., equity indices were down as a decline in the price of oil rippled through the markets. The S&P 500 Index decreased 0.80 percent, and the Russell 2000 Index dropped 1.57 percent.
• Internationally, the MSCI EAFE Index declined 0.26 percent while the MSCI Emerging Markets Index decreased 1.22 percent.


Equity Index Week-to-Date Month-to-Date Year-to-Date 12-Month
S&P 500 −0.80% −1.59% 1.37% 1.37%
Nasdaq Composite −0.79% −1.88% 7.11% 7.11%
DJIA −0.72% −1.52% 0.21% 0.21%
MSCI EAFE −0.26% −1.32% −0.81% −0.81%
MSCI Emerging Markets −1.22% −2.37% −14.92% −14.92%
Russell 2000 −1.57% −5.02% −4.41% −4.41%

Source: Bloomberg


Fixed Income Index Month-to-Date Year-to-Date 12-Month
U.S. Broad Market −0.32% 0.55% 0.55%
U.S. Treasury −0.16% 0.84% 0.84%
U.S. Mortgages −0.03% 1.51% 1.51%
Municipal Bond 0.70% 3.30% 3.30%

Source: Morningstar Direct

What to look forward to
The week will start with news on manufacturing. The ISM Manufacturing Index is expected to be up very slightly, and Factory Orders are expected to decrease.

Next, we’ll see International Trade data and the latest Federal Open Market Committee meeting minutes.

The week will end with the Employment Situation report for December.

Disclosures: Certain sections of this commentary contain forward-looking statements that are based on our reasonable expectations, estimates, projections, and assumptions. Forward-looking statements are not guarantees of future performance and involve certain risks and uncertainties, which are difficult to predict. All indices are unmanaged and are not available for direct investment by the public. Past performance is not indicative of future results. The S&P 500 is based on the average performance of the 500 industrial stocks monitored by Standard & Poor’s. The Nasdaq Composite Index measures the performance of all issues listed in the Nasdaq Stock Market, except for rights, warrants, units, and convertible debentures. The Dow Jones Industrial Average is computed by summing the prices of the stocks of 30 large companies and then dividing that total by an adjusted value, one which has been adjusted over the years to account for the effects of stock splits on the prices of the 30 companies. Dividends are reinvested to reflect the actual performance of the underlying securities. The MSCI EAFE Index is a float-adjusted market capitalization index designed to measure developed market equity performance, excluding the U.S. and Canada. The MSCI Emerging Markets Index is a market capitalization-weighted index composed of companies representative of the market structure of 26 emerging market countries in Europe, Latin America, and the Pacific Basin. The Russell 2000® Index measures the performance of the 2,000 smallest companies in the Russell 3000® Index. The Barclays Capital Aggregate Bond Index is an unmanaged market value-weighted performance benchmark for investment-grade fixed-rate debt issues, including government, corporate, asset-backed, and mortgage-backed securities with maturities of at least one year. The U.S. Treasury Index is based on the auctions of U.S. Treasury bills, or on the U.S. Treasury’s daily yield curve. The Barclays Capital Mortgage-Backed Securities (MBS) Index is an unmanaged market value-weighted index of 15- and 30-year fixed-rate securities backed by mortgage pools of the Government National Mortgage Association (GNMA), Federal National Mortgage Association (Fannie Mae), and the Federal Home Loan Mortgage Corporation (FHLMC), and balloon mortgages with fixed-rate coupons. The Barclays Capital Municipal Bond Index includes investment-grade, tax-exempt, and fixed-rate bonds with long-term maturities (greater than 2 years) selected from issues larger than $50 million. The Barclays Capital U.S. Treasury Inflation Protected Securities (TIPS) Index measures the performance of intermediate (1- to 10-year) U.S. TIPS.

###

Mark Gallagher is a financial advisor located at Gallagher Financial Services at 2586 East 7th Ave North Saint Paul, MN 55109. He offers securities and advisory services as an Investment Adviser Representative of Commonwealth Financial Network®, Member FINRA/SIPC, a Registered Investment Adviser. He can be reached at 651-774-8759 or at mark@markgallagher.com.

Authored by the Investment Research team at Commonwealth Financial Network.

© 2016 Commonwealth Financial Network®