Weekly Market Update, January 23, 2017

Presented by Mark Gallagher

General market news
• The 10-year Treasury traded in a tight range last week, with a low of 1.72 percent and a high of 1.84 percent, opening with a yield of 1.77 percent this Monday morning. The 30-year began the week with a yield of 2.63 percent after trading in the range of 2.59 percent to 2.70 percent last week.
• Equity prices shot higher in early trading last week, with domestic and international indices averaging gains of more than 3 percent. International indices managed to outperform domestic indices for the most part thanks to a weakening dollar. Growth-oriented stocks continued to outpace value stocks.
• Oil prices kept up their march higher last week, with Brent crude touching $35 per barrel for the first time since early January. Rig counts have been cut dramatically over the last year, but supply and inventories still remain high.

Equity Index Week-to-Date Month-to-Date Year-to-Date 12-Month
S&P 500 –0.13% 1.54% 1.54% 24.86%
Nasdaq Composite –0.33% 3.22% 3.22% 25.80%
DJIA –0.24% 0.43% 0.43% 29.15%
MSCI EAFE –0.47% 2.13% 2.13% 17.20%
MSCI Emerging Markets –0.30% 3.61% 3.61% 32.53%
Russell 2000 –1.46% –0.35% –0.35% 37.34%

Source: Bloomberg


Fixed Income Index Month-to-Date Year-to-Date 12-Month
U.S. Broad Market 0.03% 0.03% 1.80%
U.S. Treasury 0.09% 0.09% –0.34%
U.S. Mortgages –0.23% –0.23% 0.60%
Municipal Bond 0.59% 0.59% –0.14%

Source: Morningstar Direct

What to look forward to
The week will begin with housing data and releases of Existing and New Home Sales, both of which are expected to have been slightly weak in December.

Durable Goods Orders are expected to have improved to end the year.

The week will wrap up with the first estimate of fourth-quarter Gross Domestic Product.

Disclosures: Certain sections of this commentary contain forward-looking statements that are based on our reasonable expectations, estimates, projections, and assumptions. Forward-looking statements are not guarantees of future performance and involve certain risks and uncertainties, which are difficult to predict. All indices are unmanaged and are not available for direct investment by the public. Past performance is not indicative of future results. The S&P 500 is based on the average performance of the 500 industrial stocks monitored by Standard & Poor’s. The Nasdaq Composite Index measures the performance of all issues listed in the Nasdaq Stock Market, except for rights, warrants, units, and convertible debentures. The Dow Jones Industrial Average is computed by summing the prices of the stocks of 30 large companies and then dividing that total by an adjusted value, one which has been adjusted over the years to account for the effects of stock splits on the prices of the 30 companies. Dividends are reinvested to reflect the actual performance of the underlying securities. The MSCI EAFE Index is a float-adjusted market capitalization index designed to measure developed market equity performance, excluding the U.S. and Canada. The MSCI Emerging Markets Index is a market capitalization-weighted index composed of companies representative of the market structure of 26 emerging market countries in Europe, Latin America, and the Pacific Basin. The Russell 2000® Index measures the performance of the 2,000 smallest companies in the Russell 3000® Index. The Bloomberg Barclays US Aggregate Bond Index is an unmanaged market value-weighted performance benchmark for investment-grade fixed-rate debt issues, including government, corporate, asset-backed, and mortgage-backed securities with maturities of at least one year. The U.S. Treasury Index is based on the auctions of U.S. Treasury bills, or on the U.S. Treasury’s daily yield curve. The Bloomberg Barclays US Mortgage Backed Securities (MBS) Index is an unmanaged market value-weighted index of 15- and 30-year fixed-rate securities backed by mortgage pools of the Government National Mortgage Association (GNMA), Federal National Mortgage Association (Fannie Mae), and the Federal Home Loan Mortgage Corporation (FHLMC), and balloon mortgages with fixed-rate coupons. The Bloomberg Barclays US Municipal Index includes investment-grade, tax-exempt, and fixed-rate bonds with long-term maturities (greater than 2 years) selected from issues larger than $50 million.

 
Mark Gallagher is a financial advisor located at Gallagher Financial Services at 2586 East 7th Ave. Suite #304, North Saint Paul, MN 55109. He offers securities and advisory services as an Investment Adviser Representative of Commonwealth Financial Network®, Member FINRA/SIPC, a Registered Investment Adviser. He can be reached at 651-774-8759 or at mark@markgallagher.com.

Authored by the Investment Research team at Commonwealth Financial Network.

© 2017 Commonwealth Financial Network®
 

Market Update for the Quarter Ending December 31, 2016

Presented by Mark Gallagher

Strong end to the year for financial markets
All three major indices were up in December, capping off positive quarterly and annual returns. The Dow Jones Industrial Average led the way, gaining 3.44 percent, 8.66 percent, and 16.50 percent for the month, quarter, and year, respectively. The S&P 500 Index had lower but strong returns of 1.98 percent, 3.82 percent, and 11.96 percent for the same time frames, while the Nasdaq notched lower gains of 1.19 percent, 1.66 percent, and 8.87 percent for the periods. Technical factors were positive, as all three indices stayed above their 200-day moving averages throughout December.

In addition to the encouraging year-end market results, companies resumed earnings growth. Per FactSet, as of December 30, the estimated fourth-quarter year-over-year earnings growth rate for the S&P 500 stood at 3.2 percent.

International markets had a more mixed year than their U.S. counterparts. The MSCI EAFE Index was up 3.42 percent in December but was down 0.71 percent for the quarter and only posted a modest 1-percent gain for the year. The MSCI Emerging Markets Index rose slightly in December, 0.29 percent, though it was down 4.08 percent for the quarter despite returning a robust 11.60 percent for the year. Technicals for both indices were weak in December.

The Bloomberg Barclays U.S. Aggregate Bond Index was up 0.14 percent in December, lost 2.98 percent for the quarter on a rise in interest rates, and gained just 2.65 percent for the year. The high-yield bond market fared better, with the Bloomberg Barclays U.S. Corporate High Yield Index up 1.85 percent, 1.75 percent, and 17.13 percent for the month, quarter, and year, respectively.

Economic data looks promising
For the second year in a row, the Federal Reserve raised interest rates in December. This action, combined with forecasts for three rate hikes in 2017, signaled the Federal Open Market Committee’s belief that the economy is strong enough to withstand a gradual normalization of interest rates.

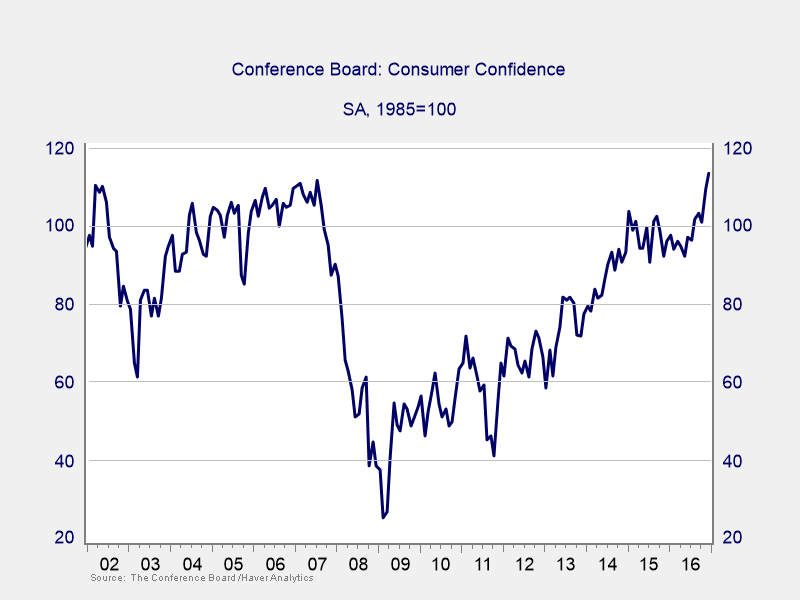
Positive economic news in December came from increased consumer confidence. Both major confidence measures rose more than expected, with the Conference Board Index reaching its highest level since 2001 (see Figure 1).

Figure 1. Conference Board Consumer Confidence, 2002−2016 

Dec quarterly update 2

Core durable goods orders were up more than expected in November. Additionally, the ISM Manufacturing and Non-Manufacturing indices continued to rise.

November employment figures, reported in early December, were strong, with 178,000 jobs added. The headline unemployment rate dropped to a post-recession 4.6-percent low.

Existing and new home sales rose more than expected in November, with existing home sales climbing to their highest level since 2007. Builder confidence also improved significantly, reaching levels not seen since the mid-2000s.

Despite the good news, there were disappointments. Personal income growth, personal spending, and retail sales all came in below expectations. Moreover, wage growth declined slightly.

Another negative data point came from industrial production, which decreased more than expected. The big driver of this decline was lower-than-forecast utility production due to unseasonably warm weather.

Political uncertainty domestically and abroad
Heading into 2017, there is a great deal of political uncertainty around the globe. In the U.S., the election of Donald J. Trump and a Republican Congress has catalyzed stock market outperformance, as investors anticipate reductions in corporate tax levels and the deregulation of many industries. But against this backdrop is the potential for the renegotiation of trade relationships, which could hinder U.S. business.

In Europe, the emerging Italian banking crisis is placing increasing pressure on the European Union; in Asia, as China’s economy slows, questions about its ability to keep growing are becoming more urgent.

Risks remain but U.S. outlook is positive
The U.S. economy continues to expand at a healthy pace with solid underlying fundamentals. Undoubtedly much attention will be given to political events in 2017, and potential risks may become reality, but the U.S. remains one of the most attractive investment destinations worldwide.

Although short-term volatility may occur, the right path for investors is to stay committed to a strategy. A well-diversified portfolio with a time horizon that matches investment goals is typically the best way to achieve desired financial aims.

All information according to Bloomberg, unless stated otherwise.

Disclosure: Certain sections of this commentary contain forward-looking statements that are based on our reasonable expectations, estimates, projections, and assumptions. Forward-looking statements are not guarantees of future performance and involve certain risks and uncertainties, which are difficult to predict. Past performance is not indicative of future results. Diversification does not assure a profit or protect against loss in declining markets. All indices are unmanaged and investors cannot invest directly into an index. The Dow Jones Industrial Average is a price-weighted average of 30 actively traded blue-chip stocks. The S&P 500 Index is a broad-based measurement of changes in stock market conditions based on the average performance of 500 widely held common stocks. The Nasdaq Composite Index measures the performance of all issues listed in the Nasdaq Stock Market, except for rights, warrants, units, and convertible debentures. The MSCI EAFE Index is a float-adjusted market capitalization index designed to measure developed market equity performance, excluding the U.S. and Canada. The MSCI Emerging Markets Index is a market capitalization-weighted index composed of companies representative of the market structure of 26 emerging market countries in Europe, Latin America, and the Pacific Basin. It excludes closed markets and those shares in otherwise free markets that are not purchasable by foreigners. The Bloomberg Barclays U.S. Aggregate Bond Index is an unmanaged market value-weighted index representing securities that are SEC-registered, taxable, and dollar-denominated. It covers the U.S. investment-grade fixed-rate bond market, with index components for a combination of the Bloomberg Barclays government and corporate securities, mortgage-backed pass-through securities, and asset-backed securities. The Bloomberg Barclays U.S. Corporate High Yield Index covers the USD-denominated, non-investment-grade, fixed-rate, taxable corporate bond market. Securities are classified as high-yield if the middle rating of Moody’s, Fitch, and S&P is Ba1/BB+/BB+ or below.


Mark Gallagher is a financial advisor located at Gallagher Financial Services at 2586 East 7th Ave. Suite #304, North Saint Paul, MN 55109. He offers securities and advisory services as an Investment Adviser Representative of Commonwealth Financial Network®, Member FINRA/SIPC, a Registered Investment Adviser. He can be reached at 651-774-8759 or at mark@markgallagher.com.

Authored by Brad McMillan, senior vice president, chief investment officer, and Sam Millette, investment research associate, at Commonwealth Financial Network®.

© 2017 Commonwealth Financial Network®

Weekly Market Update, January 9, 2017

Presented by Mark Gallagher
General market news
• Treasury rates continued to decrease, with the 10-year yield opening this week at 2.39 percent and the 30-year at 2.96 percent.
• Helped by strong wage growth in the December jobs report, markets pushed higher last week, with all three major U.S. equity indices posting gains greater than 1 percent. During market action on Friday, the Dow Jones Industrial Average came within 0.37 points of hitting 20,000 for the first time.
• Every sector was up on the week with the exception of telecom, which lost just 0.1 percent. The three best-performing sectors were health care, technology, and consumer discretionary. Health care and technology had lagged the market since the election, due in part to questions surrounding the potential impact of the president-elect’s policies on drug prices and multinational technology companies. Last week’s reversal in these industries represents a move toward more traditional growth.
• The holiday-shortened week offered multiple positive economic reports. The ISM Manufacturing Index increased significantly in December, moving to its highest level in two years. The strongest component of the report was new orders, but employment, production, and export orders also did well. The ISM Non-Manufacturing Index remained steady, suggesting that the rest of the economy performed soundly to end the year. Lastly, the December employment report showed an increase of 156,000 jobs for the month, along with a 0.4-percent gain in average hourly earnings, pushing the annual rate up to 2.9 percent.


Equity Index Week-to-Date Month-to-Date Year-to-Date 12-Month
S&P 500 1.76% 1.76% 1.76% 16.94%
Nasdaq Composite 2.58% 2.58% 2.58% 15.61%
DJIA 1.07% 1.07% 1.07% 21.29%
MSCI EAFE 1.78% 1.78% 1.78% 7.47%
MSCI Emerging Markets 2.20% 2.20% 2.20% 19.20%
Russell 2000 0.76% 0.76% 0.76% 26.86%

Source: Bloomberg


Fixed Income Index Month-to-Date Year-to-Date 12-Month
U.S. Broad Market 0.17% 0.17% 2.17%
U.S. Treasury 0.18% 0.18% 0.42%
U.S. Mortgages 0.00% 0.00% 1.16%
Municipal Bond 0.51% 0.51% -0.10%

Source: Morningstar Direct

What to look forward to
In a fairly quiet week for economic news releases, we will see Import and Export Price data for December.

Toward the end of the week, the Producer Price Index will offer insight into producer inflation in December.

Finally, Retail Sales data for December will be released.

Disclosures: Certain sections of this commentary contain forward-looking statements that are based on our reasonable expectations, estimates, projections, and assumptions. Forward-looking statements are not guarantees of future performance and involve certain risks and uncertainties, which are difficult to predict. All indices are unmanaged and are not available for direct investment by the public. Past performance is not indicative of future results. The S&P 500 is based on the average performance of the 500 industrial stocks monitored by Standard & Poor’s. The Nasdaq Composite Index measures the performance of all issues listed in the Nasdaq Stock Market, except for rights, warrants, units, and convertible debentures. The Dow Jones Industrial Average is computed by summing the prices of the stocks of 30 large companies and then dividing that total by an adjusted value, one which has been adjusted over the years to account for the effects of stock splits on the prices of the 30 companies. Dividends are reinvested to reflect the actual performance of the underlying securities. The MSCI EAFE Index is a float-adjusted market capitalization index designed to measure developed market equity performance, excluding the U.S. and Canada. The MSCI Emerging Markets Index is a market capitalization-weighted index composed of companies representative of the market structure of 26 emerging market countries in Europe, Latin America, and the Pacific Basin. The Russell 2000® Index measures the performance of the 2,000 smallest companies in the Russell 3000® Index. The Bloomberg Barclays US Aggregate Bond Index is an unmanaged market value-weighted performance benchmark for investment-grade fixed-rate debt issues, including government, corporate, asset-backed, and mortgage-backed securities with maturities of at least one year. The U.S. Treasury Index is based on the auctions of U.S. Treasury bills, or on the U.S. Treasury’s daily yield curve. The Bloomberg Barclays US Mortgage Backed Securities (MBS) Index is an unmanaged market value-weighted index of 15- and 30-year fixed-rate securities backed by mortgage pools of the Government National Mortgage Association (GNMA), Federal National Mortgage Association (Fannie Mae), and the Federal Home Loan Mortgage Corporation (FHLMC), and balloon mortgages with fixed-rate coupons. The Bloomberg Barclays US Municipal Index includes investment-grade, tax-exempt, and fixed-rate bonds with long-term maturities (greater than 2 years) selected from issues larger than $50 million.
Mark Gallagher is a financial advisor located at Gallagher Financial Services at 2586 East 7th Ave. Suite #304, North Saint Paul, MN 55109. He offers securities and advisory services as an Investment Adviser Representative of Commonwealth Financial Network®, Member FINRA/SIPC, a Registered Investment Adviser. He can be reached at 651-774-8759 or at mark@markgallagher.com.

Authored by the Investment Research team at Commonwealth Financial Network.

© 2017 Commonwealth Financial Network®

Weekly Market Update, January 3, 2017

Presented by Mark Gallagher

General market news
• Treasury rates opened lower in 2017, with the 10-year yield at 2.43 percent after climbing as high as 2.64 percent in mid-December. The 30-year yield opened at 3.05 percent after hitting 3.21 percent in mid-December, and the 2-year yield opened at 1.18 percent. The 2-year has experienced the widest swing of late, standing at 0.55 percent on July 5, at 0.78 percent on November 4, and at 1.28 percent two weeks ago.
• All three major U.S. equity indices dropped last week, with the S&P 500, Nasdaq Composite, and Dow Jones Industrial Average losing 1.08 percent, 1.43 percent, and 0.86 percent, respectively. The Dow’s slight move downward on light holiday volume was its first weekly loss since early November. News of low jobless claims and the highest consumer confidence in 15 years wasn’t enough to push the average above the 20,000 mark. Real estate was the only sector up on the week, posting a gain of 1.3 percent; the three worst-performing sectors were financials, technology, and consumer discretionary.
• The few economic reports released last week offered mixed news. The Conference Board’s measure of consumer confidence increased significantly, boosted by the expectations component. Jobless claims also remained relatively low at 268,000. The international trade report and pending home sales data were less positive. Higher mortgage rates and low supply did not help the home sales number.


Equity Index Week-to-Date Month-to-Date Year-to-Date 12-Month
S&P 500 –1.08% 1.97% 11.96% 10.91%
Nasdaq Composite –1.43% 1.20% 8.87% 7.61%
DJIA –0.86% 3.44% 16.50% 15.31%
MSCI EAFE 0.62% 3.44% 1.51% 0.86%
MSCI Emerging Markets 2.72% 0.05% 11.60% 11.98%
Russell 2000 –0.97% 2.80% 21.31% 19.86%

Source: Bloomberg


Fixed Income Index Month-to-Date Year-to-Date 12-Month
U.S. Broad Market –0.12% 2.65% 2.89%
U.S. Treasury –0.44% 1.04% 1.24%
U.S. Mortgages –0.16% 1.67% 1.92%
Municipal Bond 0.78% 0.25% 0.27%

Source: Morningstar Direct

What to look forward to
The first week of the New Year will begin with ISM Manufacturing Index data for December.

The minutes from the December meeting of the Federal Open Market Committee will be released Wednesday.

The week’s focus will be the December Employment report, to be released Friday.

Disclosures: Certain sections of this commentary contain forward-looking statements that are based on our reasonable expectations, estimates, projections, and assumptions. Forward-looking statements are not guarantees of future performance and involve certain risks and uncertainties, which are difficult to predict. All indices are unmanaged and are not available for direct investment by the public. Past performance is not indicative of future results. The S&P 500 is based on the average performance of the 500 industrial stocks monitored by Standard & Poor’s. The Nasdaq Composite Index measures the performance of all issues listed in the Nasdaq Stock Market, except for rights, warrants, units, and convertible debentures. The Dow Jones Industrial Average is computed by summing the prices of the stocks of 30 large companies and then dividing that total by an adjusted value, one which has been adjusted over the years to account for the effects of stock splits on the prices of the 30 companies. Dividends are reinvested to reflect the actual performance of the underlying securities. The MSCI EAFE Index is a float-adjusted market capitalization index designed to measure developed market equity performance, excluding the U.S. and Canada. The MSCI Emerging Markets Index is a market capitalization-weighted index composed of companies representative of the market structure of 26 emerging market countries in Europe, Latin America, and the Pacific Basin. The Russell 2000® Index measures the performance of the 2,000 smallest companies in the Russell 3000® Index. The Bloomberg Barclays US Aggregate Bond Index is an unmanaged market value-weighted performance benchmark for investment-grade fixed-rate debt issues, including government, corporate, asset-backed, and mortgage-backed securities with maturities of at least one year. The U.S. Treasury Index is based on the auctions of U.S. Treasury bills, or on the U.S. Treasury’s daily yield curve. The Bloomberg Barclays US Mortgage Backed Securities (MBS) Index is an unmanaged market value-weighted index of 15- and 30-year fixed-rate securities backed by mortgage pools of the Government National Mortgage Association (GNMA), Federal National Mortgage Association (Fannie Mae), and the Federal Home Loan Mortgage Corporation (FHLMC), and balloon mortgages with fixed-rate coupons. The Bloomberg Barclays US Municipal Index includes investment-grade, tax-exempt, and fixed-rate bonds with long-term maturities (greater than 2 years) selected from issues larger than $50 million.

Mark Gallagher is a financial advisor located at Gallagher Financial Services at 2586 East 7th Ave. Suite #304, North Saint Paul, MN 55109. He offers securities and advisory services as an Investment Adviser Representative of Commonwealth Financial Network®, Member FINRA/SIPC, a Registered Investment Adviser. He can be reached at 651-774-8759 or at mark@markgallagher.com.

Authored by the Investment Research team at Commonwealth Financial Network.

© 2017 Commonwealth Financial Network®