Weekly Market Update, February 18, 2020

Presented by Mark Gallagher

General Market News
• Rates fell slightly last week, as concerns regarding the spread of the coronavirus continued to rattle investors. The 10-year Treasury yield fell to 1.54 percent to start the week, and the 30-year fell to 1.99 percent.
• Both domestic and emerging markets moved higher last week, while international developed markets remained flat. Utilities and REITs outperformed, supported by concerns about the impact of the coronavirus on global growth. These sectors were followed by consumer discretionary and technology, with the University of Michigan consumer sentiment survey surprising to the upside on Friday. The largest individual contributor was Nvidia, which was up more than 15 percent after beating sales and earnings expectations. Other top contributors included companies with heavy consumer exposure, such as Amazon, Visa, and Mastercard. The worst-performing sectors included materials, energy, and consumer staples.
• On Thursday, January’s Consumer Price Index (CPI) report was released. Consumer prices increased by a modest 0.1 percent during the month, which led to year-over-year growth of 2.5 percent. This is a slight increase from the 2.3 percent year-over-year growth we saw in December. Core CPI, which strips out the impact of volatile food and energy prices, rose by 0.2 percent for the month and 2.4 percent year-over-year. Even with the slight uptick in January, and three Federal Reserve (Fed) interest rate cuts last year, inflation remains modest. Fed board members have indicated they are comfortable with inflation coming in above their stated 2 percent target, so there is no major concern for the time being.
• Friday saw the release of January’s retail sales report. Headline sales grew by 0.3 percent during the month, marking four straight months of sales growth. Excluding volatile auto and gas purchases, the results were even better, with 0.4 percent growth in January. This was above economist estimates for 0.3 percent growth. Sales of building materials and furniture were two of the fastest-growing categories, spurred by mild weather and a strong housing market. Consumer spending was a major driver of gross domestic product growth in 2019, so this strong start to the year is a good sign for the economy as we kick off 2020.
• Friday also saw the release of December’s industrial production report, which came in slightly lower than estimates. Production declined by 0.3 percent during the month, against expectations for a 0.2 percent drop. This decline was caused in large part by a slowdown in utilities output, driven by January’s mild weather. Manufacturing output declined by 0.1 percent in January, which was in line with expectations. This decline was due largely to Boeing’s decision to temporarily halt production on the 737 MAX aircraft, as manufacturing output excluding aircraft rose by 0.3 percent during the month.
• We finished the week with the first reading of the University of Michigan consumer sentiment survey for February. Sentiment increased from 99.8 in January to 100.9 in February, despite forecasts for a slight decline to 99.5. This better-than-expected result brought the index to its highest level in nearly two years. The surprisingly strong January employment report, combined with positive equity markets and a healthy housing market, helped bolster consumer confidence.

Equity Index Week-to-Date Month-to-Date Year-to-Date 12-Month
S&P 500 1.65% 4.91% 4.87% 24.21%
Nasdaq Composite 2.23% 6.40% 8.56% 31.62%
DJIA 1.17% 4.27% 3.34% 16.31%
MSCI EAFE –0.02% 1.83% –0.30% 13.50%
MSCI Emerging Markets 1.37% 4.16% –0.70% 10.11%
Russell 2000 1.90% 4.62% 1.27% 9.10%

Source: Bloomberg

Fixed Income Index Month-to-Date Year-to-Date 12-Month
U.S. Broad Market 0.03% 1.88% 9.56%
U.S. Treasury –0.01% 2.15% 8.68%
U.S. Mortgages 0.01% 0.84% 6.53%
Municipal Bond 0.10% 1.78% 8.32%

Source: Morningstar Direct

What to Look Forward To
We’ll start the week with Monday’s release of the National Association of Home Builders Housing Market Index for February. This gauge of home builder confidence dropped one point, to 74, against expectations to remain steady. The index sits two points below a 20-year high. Home builder confidence has been supported by very strong home buyer demand, as demonstrated by the subindex that tracks prospective buyer traffic, which hit its highest level since 1998 in December. Falling mortgage rates and high consumer confidence have been driving more prospective buyers into the market, though supply continues to be a constraint. Home builders have noticed and ramped up construction accordingly.

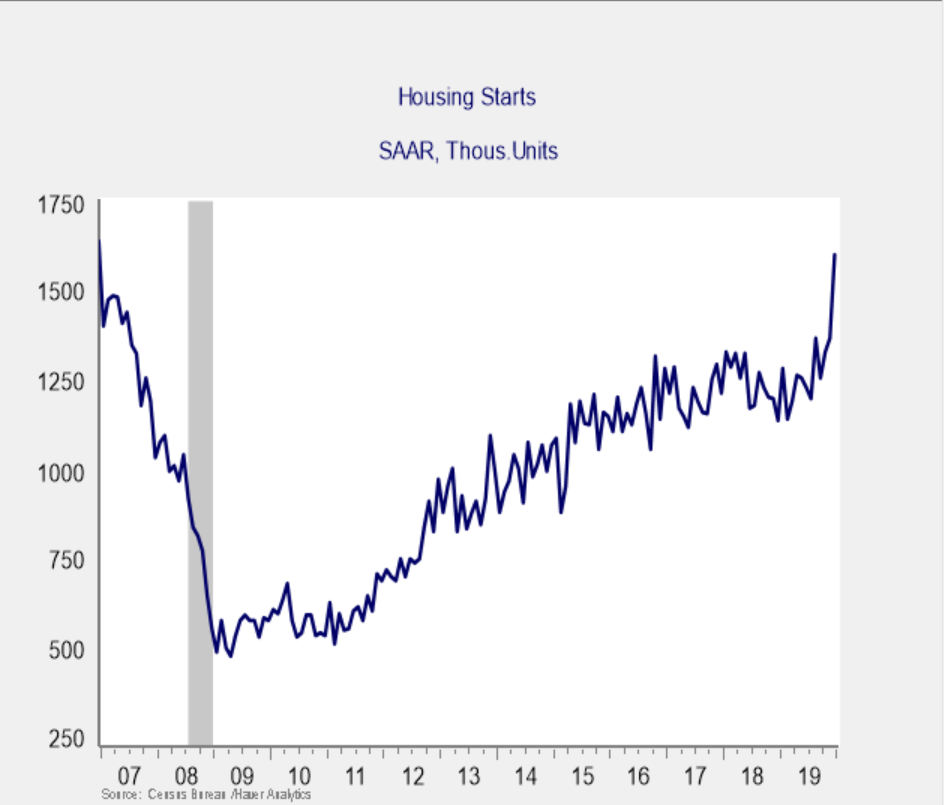
Speaking of construction, on Tuesday, January’s building permits and housing starts reports will be released. Permits are expected to show moderate 2.1 percent growth, while starts are set to decline by 12.9 percent. While this anticipated drop in housing starts is notable, starts can be very volatile on a monthly basis, as evidenced by the 16.9 percent increase seen in December. Despite their tendency to fluctuate, housing starts showed a clear upward trend throughout 2019. Constrained supply and high buyer demand made home builders eager to start new construction as quickly as possible. If the estimates for January are accurate, housing starts will be at their second-highest monthly level since 2006, giving us no cause for concern.

Tuesday will also see the release of January’s Producer Price Index. Producer inflation is slated to increase by 0.1 percent during the month and 1.6 percent year-over-year. Core prices that exclude volatile food and energy prices are set to increase by 0.2 and 1.3 percent for the month and year, respectively. As noted with consumer prices, inflation remains muted despite the Fed’s supportive rate cuts last year. This measure of producer inflation has been below the Fed’s 2 percent target since May 2019.

On Wednesday, the minutes from the January Federal Open Market Committee meeting will be released. The Fed unanimously voted to keep the federal funds rate unchanged. Given this decision, as well as recent testimony from Fed Chairman Jerome Powell to Congress, the minutes are unlikely to contain any major surprises. We may get some commentary regarding the Fed’s plans to unwind its ongoing involvement in the repurchase market. Overall, however, the minutes are expected to give us an insight into the Fed’s views on the current economic expansion rather than revelations.

We’ll finish out the week with Friday’s release of January’s existing home sales report. Economists are forecasting a modest decline of 1.2 percent, following a 3.6 percent gain in December. Despite such a drop, the forecasted result would represent more than 10 percent growth on a year-over-year basis. It would also mark seven straight months with year-over-year growth, demonstrating a very solid turnaround from the prolonged slowdown in sales throughout 2018. Housing’s rebound has been one of the bright spots of the economic expansion, so a continued recovery would be quite welcome.

Disclosures: Certain sections of this commentary contain forward-looking statements that are based on our reasonable expectations, estimates, projections, and assumptions. Forward-looking statements are not guarantees of future performance and involve certain risks and uncertainties, which are difficult to predict. All indices are unmanaged and are not available for direct investment by the public. Past performance is not indicative of future results. The S&P 500 is based on the average performance of the 500 industrial stocks monitored by Standard & Poor’s. The Nasdaq Composite Index measures the performance of all issues listed in the Nasdaq Stock Market, except for rights, warrants, units, and convertible debentures. The Dow Jones Industrial Average is computed by summing the prices of the stocks of 30 large companies and then dividing that total by an adjusted value, one which has been adjusted over the years to account for the effects of stock splits on the prices of the 30 companies. Dividends are reinvested to reflect the actual performance of the underlying securities. The MSCI EAFE Index is a float-adjusted market capitalization index designed to measure developed market equity performance, excluding the U.S. and Canada. The MSCI Emerging Markets Index is a market capitalization-weighted index composed of companies representative of the market structure of 26 emerging market countries in Europe, Latin America, and the Pacific Basin. The Russell 2000® Index measures the performance of the 2,000 smallest companies in the Russell 3000® Index. The Bloomberg Barclays US Aggregate Bond Index is an unmanaged market value-weighted performance benchmark for investment-grade fixed-rate debt issues, including government, corporate, asset-backed, and mortgage-backed securities with maturities of at least one year. The U.S. Treasury Index is based on the auctions of U.S. Treasury bills, or on the U.S. Treasury’s daily yield curve. The Bloomberg Barclays US Mortgage Backed Securities (MBS) Index is an unmanaged market value-weighted index of 15- and 30-year fixed-rate securities backed by mortgage pools of the Government National Mortgage Association (GNMA), Federal National Mortgage Association (Fannie Mae), and the Federal Home Loan Mortgage Corporation (FHLMC), and balloon mortgages with fixed-rate coupons. The Bloomberg Barclays US Municipal Index includes investment-grade, tax-exempt, and fixed-rate bonds with long-term maturities (greater than 2 years) selected from issues larger than $50 million.

Mark Gallagher is a financial advisor located at Gallagher Financial Services at 2586 East 7th Ave. Suite #304, North Saint Paul, MN 55109. He offers securities and advisory services as an Investment Adviser Representative of Commonwealth Financial Network®, Member FINRA/SIPC, a Registered Investment Adviser. He can be reached at 651-774-8759 or at mark@markgallagher.com.

Authored by the Investment Research team at Commonwealth Financial Network.

© 2020 Commonwealth Financial Network ®


Market Update for the Month Ending January 31, 2020

Presented by Mark Gallagher

Coronavirus outbreak leads to mixed results for markets
January was a mixed month for markets, with concerns about the spread of the Wuhan coronavirus having a negative effect at month-end. Despite spending most of the month in positive territory, both the S&P 500 and the Dow Jones Industrial Average declined. The former fell 0.04 percent while the latter dropped 0.89 percent. The Nasdaq Composite also saw some late-month volatility, but previous gains were strong enough to leave the index up 2.03 percent for the month.

Despite the rocky ending to the month, fundamentals may be showing signs of improvement. Per Bloomberg Intelligence, as of January 31, the blended year-over-year earnings growth estimate for the S&P 500 in the fourth quarter is –0.3 percent. If this estimate holds, it would mark four straight quarters with earnings declines. The situation has been improving, however, and analysts are currently forecasting a return to growth in the first quarter of 2020. Fundamentals drive market returns, so earnings growth this quarter would create a tailwind for future returns. From a technical perspective, all three major U.S. indices remained well above their respective 200-day moving averages.

International markets had a tough start to the year, facing more volatility than their U.S. counterparts. The MSCI EAFE Index fell by 2.09 percent in January, with much of the decline coming in the final week of the month. The MSCI Emerging Markets Index faced pressure as well, falling 4.66 percent. Concerns about the coronavirus and the effect it could have on China’s growth were the primary causes. Both indices remained above their 200-day moving averages, though, indicating continued investor support.

The broad fixed income market, on the other hand, had a very strong start to the year, as the general risk-off sentiment drove investors into safe-haven assets. Long-term U.S. Treasury yields fell sharply in January. The 10-year yield declined from 1.88 percent at the start of the month to 1.51 percent at month-end. This brought yields on the long end of the curve back down to October lows and drove the Bloomberg Barclays U.S. Aggregate Bond Index to a gain of 1.92 percent.

Although investment-grade fixed income started the year off well, the same can’t be said for high-yield bonds. This portion of the fixed income market is typically not driven much by movements in interest rates; rather, it’s more correlated with equities, due to the speculative nature of high-yield bonds. High-yield spreads increased notably during the month, as investors demanded greater yield to compensate for the additional credit risk. The Bloomberg Barclays U.S. Corporate High Yield Index inched up by 0.03 percent.

Shifting geopolitical risks affect markets
January provided a prime example of why it is important to expect the unexpected and construct portfolios that can withstand short-term market volatility. Throughout the month, several geopolitical risks grabbed headlines and rocked markets.

The most significant was the discovery and spread of the coronavirus, which was declared a public health emergency by the World Health Organization at the end of January. Governments around the world have taken swift action to work toward halting the spread of the disease. Still, it has been the major driver of global market volatility.

Here in the U.S., the spread of the virus appears to be contained for now, so the effect on public health has been minimal. The potential economic impact is not yet clear, however. So far, travel and technology companies have been hit the hardest. But as we saw with the market sell-off at the end of the month, investors were also spooked by the continued spread of the disease and general uncertainty created by the situation. Ultimately, we can’t predict what the final economic cost and public health implications will be, so we can expect to see more volatility in line with the headlines.

Another major news story during the month was the escalation of military tensions between the U.S. and Iran. Notably, a U.S. strike killed an Iranian general in Iraq. It was followed by the retaliatory strike from Iran on two Iraqi airbases that were housing American military personnel. This unexpected development captured global attention due to the potential for further escalation in the war-torn region. Although this story was in the headlines for more than a week, its effect on financial markets was short-lived.

Both of these events showed how unexpected risks can grab investors’ attention and lead to market gyrations. As we saw with the Iran situation, though, once more clarity becomes available, markets can recover swiftly from these short-term jolts. Therefore, building a portfolio that can withstand the occasional bout of volatility should be an important goal for any investor.

Economic data improves
Despite the news-driven market turmoil we saw at month-end, the economic data releases in January continued to show improving fundamentals in the U.S. After staying rangebound for much of the fourth quarter, both major surveys of consumer confidence climbed by more than expected in January. A strong jobs market and increased optimism about future equity market returns drove much of this better-than-expected result. High consumer confidence often leads to additional consumer spending. So, seeing both confidence measures increase bodes well for first-quarter growth.

Consumer spending data was healthy, with the most recent retail sales report showing 0.3 percent growth in December. This brought year-over-year growth up to 5.8 percent, the highest it’s been since August 2018. Headline sales figures were held back by slow auto sales, though. Excluding cars, retail sales increased by a strong 0.7 percent in December, the best monthly result since July. Even though these retail sales results were strong, it was the housing sector that truly impressed.

Housing continues to be a bright spot in the economic expansion. Low mortgage rates and high consumer confidence have driven prospective buyers into the market. Existing home sales increased by more than expected during the month, reaching the highest level since February 2018. Even this strong result was likely held back due to lack of supply; existing homes available for sale have declined for seven straight months and are down 8.5 percent year-over-year. Declining supply is a headwind for potential home buyers, but it has been a boon for builders, who ramped up construction at the end of 2019.

As you can see in Figure 1, housing starts grew dramatically at year-end, reaching post-recession highs. Home builder confidence remains near 20-year highs, driven by buyer foot traffic at levels last seen in 1998. We’ve already begun to feel the positive effects from this building spree on the economy. Residential investment grew at the fastest rate in two years in the fourth quarter, and it was a positive contributor to fourth-quarter gross domestic product growth. The housing sector has an outsize effect on the economy due to the associated knock-on purchases that come with buying a house. So, the rebound we saw at the end of 2019 is very welcome, and we appear to be poised for continued growth in the new year.

Figure 1. Housing Starts 2007–Present

Economy continues to grow, but risks remain
January showed how important it is to be aware that risks to financial markets can strike suddenly and without warning. The volatility we experienced at month-end was caused in large part by fear of the unknown, which can rock markets at any time.

From an economic perspective, the strong consumer surveys point to future spending growth. As long as consumers remain willing and able to spend, the economic expansion will likely continue, given the importance of the American consumer to overall economic health.

Remember, there is always the potential for suddenly emerging risks to affect markets, even when the economic environment is positive. That’s why a well-diversified portfolio that matches investor goals and time horizons remains the best path forward.

All information according to Bloomberg, unless stated otherwise.

Disclosure: Certain sections of this commentary contain forward-looking statements based on our reasonable expectations, estimates, projections, and assumptions. Forward-looking statements are not guarantees of future performance and involve certain risks and uncertainties, which are difficult to predict. Past performance is not indicative of future results. Diversification does not assure a profit or protect against loss in declining markets. All indices are unmanaged and investors cannot invest directly into an index. The Dow Jones Industrial Average is a price-weighted average of 30 actively traded blue-chip stocks. The S&P 500 Index is a broad-based measurement of changes in stock market conditions based on the average performance of 500 widely held common stocks. The Nasdaq Composite Index measures the performance of all issues listed in the Nasdaq Stock Market, except for rights, warrants, units, and convertible debentures. The MSCI EAFE Index is a float-adjusted market capitalization index designed to measure developed market equity performance, excluding the U.S. and Canada. The MSCI Emerging Markets Index is a market capitalization-weighted index composed of companies representative of the market structure of 26 emerging market countries in Europe, Latin America, and the Pacific Basin. It excludes closed markets and those shares in otherwise free markets that are not purchasable by foreigners. The Bloomberg Barclays Aggregate Bond Index is an unmanaged market value-weighted index representing securities that are SEC-registered, taxable, and dollar-denominated. It covers the U.S. investment-grade fixed-rate bond market, with index components for a combination of the Bloomberg Barclays government and corporate securities, mortgage-backed pass-through securities, and asset-backed securities. The Bloomberg Barclays U.S. Corporate High Yield Index covers the USD-denominated, non-investment-grade, fixed-rate, taxable corporate bond market. Securities are classified as high-yield if the middle rating of Moody’s, Fitch, and S&P is Ba1/BB+/BB+ or below.


Mark Gallagher is a financial advisor located at Gallagher Financial Services at 2586 East 7th Ave. Suite #304, North Saint Paul, MN 55109. He offers securities and advisory services as an Investment Adviser Representative of Commonwealth Financial Network®, Member FINRA/SIPC, a Registered Investment Adviser. He can be reached at 651-774-8759 or at mark@markgallagher.com.

Authored by Brad McMillan, CFA®, CAIA, MAI, managing principal, chief investment officer, and Sam Millette, senior investment research analyst, at Commonwealth Financial Network®.

© 2020 Commonwealth Financial Network®

Weekly Market Update, February 3, 2020

Presented by Mark Gallagher

General Market News
• Rates continued their downward trend last week, with the 10-year Treasury closing at 1.50 percent on Friday. It opened slightly higher at 1.53 percent on Monday. Three weeks ago, it was as high as 1.90 percent. The 30-year yield broke the 2 percent resistance level, hitting 1.99 percent, after being as high as 2.38 percent last month. The short end of the curve remains inverted, with the 2-year at 1.34 percent and the 3-year at 1.32 percent.
• Global markets continued their sell-off, as concerns over the spread of the Wuhan Coronavirus continued to escalate. The World Health Organization declared the outbreak of the virus a public health emergency, and several airlines (including United, Delta, and American) canceled flights to China. The markets took a risk-off approach. WTI crude oil fell by 4.9 percent due to expectations for a short-term decline in oil demand with the numerous travel restrictions in place.
• The worst-performing sectors on the week were energy, materials, and health care. Those among the top performers were utilities, consumer discretionary, and consumer staples. The discretionary sector stood out due to the strong performance of Amazon’s cloud division, as well as its growth in Prime subscribership.
• We started off the week with Monday’s release of the December new home sales report. New home sales fell 0.4 percent, against expectations for a 1.5 percent increase. New home sales are a relatively small portion of overall sales, and the results can often be more volatile than existing home sales on a monthly basis. Despite the disappointing December result, new home sales continue to exhibit strong growth, with year-over-year sales up 23.7 percent when compared with December 2018.
• On Tuesday, December’s durable goods orders report for December was released. Headline durable goods grew by 2.4 percent month-over-month, against expectations for 0.3 percent growth. This better-than-expected result was due to a rebound in volatile defensive aircraft orders—the major cause of November’s downwardly revised 3.1 percent decline in orders. Core durable goods orders, which strip out the impact of volatile transportation orders, declined by 0.1 percent during the month, which was below expectations for 0.3 percent growth. This marks the second straight month with declining core orders, as November’s core orders declined by 0.4 percent.
• Tuesday also saw the release of the Conference Board Consumer Confidence Index for January. Consumer confidence increased by more than expected during the month, with the index rising from an upwardly revised 128.2 in December to 131.6 in January. Confidence now sits at a four-month high. Improving consumer confidence tends to support additional spending growth, so this was a very encouraging result to start the year.
• On Thursday, the first estimate for fourth-quarter gross domestic product growth was released. The economy grew at an annualized rate of 2.1 percent during the quarter, against economist estimates for a 2 percent growth rate. This was in line with the 2.1 percent growth we saw in the third quarter. Net trade was the major driver of growth in the fourth quarter, as a sharp drop in imports and a modest increase in exports created a tailwind for domestic growth.
• On Friday, December’s personal income and personal spending reports were released. Both income and spending increased during the month, with incomes rising by 0.2 percent while spending grew by 0.3 percent. This marks the 10th straight month with spending growth. Personal income and spending both grew at a similar pace throughout 2019, indicating that the spending growth that occurred during the year was sustainable. On a year-over-year basis, personal income rose by 4.5 percent in 2019, while spending grew by a solid 4 percent.
• Finally, we finished the week with the second and final reading of the University of Michigan consumer sentiment survey. Consumer sentiment increased during the month, up from 99.1 midmonth to 99.8 at month-end. Economists had previously forecasted no changes for the index. This brings the index to an eight-month high, which is very impressive, given that the index hit a three-year low in August. This swift recovery, despite ongoing geopolitical uncertainty, is encouraging for the new year. With both of the major consumer surveys coming in better than expected during the month, the prospects for additional consumer spending growth in the first quarter are strong.

Equity Index Week-to-Date Month-to-Date Year-to-Date 12-Month
S&P 500 –2.10% –0.04% –0.04% 21.56%
Nasdaq Composite –1.75% 2.03% 2.03% 27.35%
DJIA –2.52% –0.89% –0.89% 15.49%
MSCI EAFE –2.50% –2.09% –2.09% 12.16%
MSCI Emerging Markets –5.09% –4.66% –4.66% 3.78%
Russell 2000 –2.89% –3.21% –3.21% 9.02%

Source: Bloomberg

Fixed Income Index Month-to-Date Year-to-Date 12-Month
U.S. Broad Market 1.92% 1.92% 9.92%
U.S. Treasury 2.44% 2.44% 9.26%
U.S. Mortgages 0.70% 0.70% 6.60%
Municipal Bond 1.80% 1.80% 8.68%

Source: Morningstar Direct

What to Look Forward To
We started the week with Monday’s release of the Institute for Supply Management (ISM) Manufacturing index. This measure of manufacturer confidence rose sharply from 47.2 in December to 50.9 in January, well above the expected increase to 48.4. This is a diffusion index, where values below 50 indicate contraction, so this encouraging result takes manufacturing back to expansion. Manufacturer confidence fell sharply in 2019, and this rebound may be a sign that the phase one trade deal between the U.S. and China is starting to bolster manufacturer confidence.

On Wednesday, December’s international trade report is set to be released. Economists expect the trade gap to widen, partially offsetting the November tightening that shrunk the deficit to a three-year low. The November result was due to a sharp drop in imports, caused by businesses preparing for new tariffs on Chinese goods to go into effect in December. According to advanced trade data, however, we’ll get a rebound in imported goods in December. Trade data will likely remain volatile as negotiations between the U.S. and China continue. There is some hope, however, that things will settle down slightly with the signing of the phase one trade deal between the two countries in January.

On Wednesday, the ISM Nonmanufacturing index is scheduled to be released. This index, which measures service sector confidence, should increase modestly from 55 in December to 55.1 in January. This is another diffusion index, where values above or below 50 indicate expansion or contraction, respectively. Accordingly, this result would be welcome, especially if manufacturing confidence also rises in January. The ISM Composite index (which combines manufacturer and service sector confidence) currently sits at a four-month high. Increased business confidence supports additional business investment, so further advances in this index would certainly be a positive development.

On Friday, January’s employment report is set for release. Economists anticipate that 160,000 new jobs will be added during the month, a step up from the 145,000 created in December. The underlying data is also expected to be solid. The unemployment rate should remain at 3.5 percent, while average hourly earnings growth is likely to increase by 0.3 percent. While the pace of new job creation slowed to start 2019, results in the fourth quarter largely beat expectations. Consumers cited the strong job market as a primary factor for increased confidence in January. Continued strength in employment would be another welcome signal that economic growth has picked up after moderating in 2019.

Disclosures: Certain sections of this commentary contain forward-looking statements that are based on our reasonable expectations, estimates, projections, and assumptions. Forward-looking statements are not guarantees of future performance and involve certain risks and uncertainties, which are difficult to predict. All indices are unmanaged and are not available for direct investment by the public. Past performance is not indicative of future results. The S&P 500 is based on the average performance of the 500 industrial stocks monitored by Standard & Poor’s. The Nasdaq Composite Index measures the performance of all issues listed in the Nasdaq Stock Market, except for rights, warrants, units, and convertible debentures. The Dow Jones Industrial Average is computed by summing the prices of the stocks of 30 large companies and then dividing that total by an adjusted value, one which has been adjusted over the years to account for the effects of stock splits on the prices of the 30 companies. Dividends are reinvested to reflect the actual performance of the underlying securities. The MSCI EAFE Index is a float-adjusted market capitalization index designed to measure developed market equity performance, excluding the U.S. and Canada. The MSCI Emerging Markets Index is a market capitalization-weighted index composed of companies representative of the market structure of 26 emerging market countries in Europe, Latin America, and the Pacific Basin. The Russell 2000® Index measures the performance of the 2,000 smallest companies in the Russell 3000® Index. The Bloomberg Barclays US Aggregate Bond Index is an unmanaged market value-weighted performance benchmark for investment-grade fixed-rate debt issues, including government, corporate, asset-backed, and mortgage-backed securities with maturities of at least one year. The U.S. Treasury Index is based on the auctions of U.S. Treasury bills, or on the U.S. Treasury’s daily yield curve. The Bloomberg Barclays US Mortgage Backed Securities (MBS) Index is an unmanaged market value-weighted index of 15- and 30-year fixed-rate securities backed by mortgage pools of the Government National Mortgage Association (GNMA), Federal National Mortgage Association (Fannie Mae), and the Federal Home Loan Mortgage Corporation (FHLMC), and balloon mortgages with fixed-rate coupons. The Bloomberg Barclays US Municipal Index includes investment-grade, tax-exempt, and fixed-rate bonds with long-term maturities (greater than 2 years) selected from issues larger than $50 million.


Mark Gallagher is a financial advisor located at Gallagher Financial Services at 2586 East 7th Ave. Suite #304, North Saint Paul, MN 55109. He offers securities and advisory services as an Investment Adviser Representative of Commonwealth Financial Network®, Member FINRA/SIPC, a Registered Investment Adviser. He can be reached at 651-774-8759 or at mark@markgallagher.com.

© 2020 Commonwealth Financial Network ®

Weekly Market Update, January 27, 2020

Presented by Mark Gallagher

General Market News
• On Monday, the 10-year Treasury opened at 1.60 percent, down from last week’s 1.82 percent. The 30-year yield opened at 2.08 percent, dropping from 2.30 percent. The short end of the curve is inverted again, with the 2-year yield at 1.45 percent and the 3-year yield at 1.42 percent.
• Global markets sold off last week, as the spread of the Wuhan coronavirus has led to concerns over its effect on global growth. The Chinese government has restricted travel ahead of the Lunar New Year to help prevent the spread of the virus. The holiday was also extended to February 2 in an effort to keep citizens at home.
• Concerns amid global growth caused West Texas Intermediate to fall by 7.5 percent. This decline pulled energy as a whole down by 4 percent, making it the worst-performing sector. Other lagging sectors included materials and financials. The top-performing sectors were utilities, real estate, and technology. Technology was supported by a large beat by Intel, as the growth of its cloud service segment accelerated.
• On Wednesday, December’s existing home sales report was released. Sales of existing homes rose 3.6 percent, against expectations for 1.5 percent growth. This result brought the pace of sales to the highest level since February 2018. The housing sector staged a very impressive rebound in the second half of 2019 after slowing in late 2018, and these results point toward further growth in 2020. Low mortgage rates and high consumer confidence have drawn more prospective buyers into the market, leading to the impressive results we saw at the end of 2019.

Equity Index Week-to-Date Month-to-Date Year-to-Date 12-Month
S&P 500 –1.01% 2.10% 2.10% 26.17%
Nasdaq Composite –0.79% 3.84% 3.84% 31.42%
DJIA –1.20% 1.68% 1.68% 20.06%
MSCI EAFE –0.61% 0.42% 0.42% 16.12%
MSCI Emerging Markets –2.39% 0.46% 0.46% 11.25%
Russell 2000 –2.19% –0.33% –0.33% 13.73%

Source: Bloomberg

Fixed Income Index Month-to-Date Year-to-Date 12-Month
U.S. Broad Market 1.30% 1.30% 9.82%
U.S. Treasury 1.50% 1.50% 8.66%
U.S. Mortgages 0.51% 0.51% 6.88%
Municipal Bond 1.42% 1.42% 8.69%

Source: Morningstar Direct

What to Look Forward To
We started off the week with Monday’s release of the December new home sales report. Sales came in lower than predicted, falling 0.4 percent during the month against expectations for a 1.5 percent increase. New home sales are a relatively small portion of overall sales, however, and the results can often be more volatile than existing home sales on a monthly basis. So, despite the disappointing result, if we look at longer-term trends, new home sales are continuing to exhibit strong growth. Growth in year-over-year sales was up to 23.7 percent compared to December 2018. As for supply of new homes on the market, this area remains constrained. But the uptick in construction we’ve seen recently could help fuel sales growth as more homes become available for purchase. Given the strength in year-over-year growth and the potential tailwinds from new construction, the disappointing monthly result is nothing to be worried about for the time being.

On Tuesday, December’s durable goods orders report will be released. Durable goods orders are expected to increase by 1.2 percent, following a surprising decline of 2.1 percent in November. November’s results were caused by a sharp drop in volatile defensive aircraft orders, so a return to growth would help calm concerns of a prolonged slowdown in headline orders. Core orders, which strip out the impact of volatile transportation orders, are expected to show healthy 0.4 percent growth, following a 0.1 percent decline in November. Core orders are often seen as a proxy for business investment, so a return to growth here would be positive. It could signal a turnaround for business investment as we head into the new year.

Tuesday will also see the release of the Conference Board Consumer Confidence Index for January. It is set to increase to 128 in January, up from 126.5 in December. With confidence virtually unchanged in the fourth quarter, a return to growth would be a positive development, given that rising consumer confidence supports faster consumer spending. But even if we get an increase, the index would still sit below 2019’s high-water mark of 135.8. We have some ways to go before confidence is restored to the recent highs. With that being said, markets continue to set new highs, housing prices continue to increase, and jobs remain plentiful, so there is every reason to believe that confidence can recover.

On Thursday, the first estimate of fourth-quarter gross domestic product (GDP) growth will be released. Economist are calling for results showing faster growth. Will the economy expand at a 2.2 percent annualized rate, up from 2.1 percent in the third quarter? This result would be lower than the 3.2 percent growth rate we saw in the first quarter of 2019, but in line with the overall pace of growth for last year. Personal consumption, the major driver of economic growth in the second and third quarters, is expected to grow at an annualized rate of 2.3 percent during the fourth quarter, down from 3.2 percent in the third quarter. Given the importance of consumer spending to midyear expansion, GDP growth will bear watching as we kick off the new year.

Friday will see the release of December’s personal income and personal spending reports. Economists expect to see both income and spending grow by a healthy 0.3 percent during the month, to cap off a solid year of growth. If the estimates prove accurate, December would mark the 10th straight month with increased personal spending. Spending grew at a similar rate throughout most of 2019, which indicates it was well supported by increasing incomes.

Finally, we’ll finish the week with Friday’s release of the second and final estimate of the University of Michigan consumer confidence survey for January. The first estimate showed confidence declining slightly from 99.3 in December to 99.1 in January. Economists expect a further modest decline, to 99, for the second estimate. But the index still sits well above the three-year low of 89.9 it hit in August, so there is no immediate cause for concern. Nonetheless, consumer confidence will be an important indicator to watch going forward, given the relationship between confidence and spending.

Disclosures: Certain sections of this commentary contain forward-looking statements that are based on our reasonable expectations, estimates, projections, and assumptions. Forward-looking statements are not guarantees of future performance and involve certain risks and uncertainties, which are difficult to predict. All indices are unmanaged and are not available for direct investment by the public. Past performance is not indicative of future results. The S&P 500 is based on the average performance of the 500 industrial stocks monitored by Standard & Poor’s. The Nasdaq Composite Index measures the performance of all issues listed in the Nasdaq Stock Market, except for rights, warrants, units, and convertible debentures. The Dow Jones Industrial Average is computed by summing the prices of the stocks of 30 large companies and then dividing that total by an adjusted value, one which has been adjusted over the years to account for the effects of stock splits on the prices of the 30 companies. Dividends are reinvested to reflect the actual performance of the underlying securities. The MSCI EAFE Index is a float-adjusted market capitalization index designed to measure developed market equity performance, excluding the U.S. and Canada. The MSCI Emerging Markets Index is a market capitalization-weighted index composed of companies representative of the market structure of 26 emerging market countries in Europe, Latin America, and the Pacific Basin. The Russell 2000® Index measures the performance of the 2,000 smallest companies in the Russell 3000® Index. The Bloomberg Barclays US Aggregate Bond Index is an unmanaged market value-weighted performance benchmark for investment-grade fixed-rate debt issues, including government, corporate, asset-backed, and mortgage-backed securities with maturities of at least one year. The U.S. Treasury Index is based on the auctions of U.S. Treasury bills, or on the U.S. Treasury’s daily yield curve. The Bloomberg Barclays US Mortgage Backed Securities (MBS) Index is an unmanaged market value-weighted index of 15- and 30-year fixed-rate securities backed by mortgage pools of the Government National Mortgage Association (GNMA), Federal National Mortgage Association (Fannie Mae), and the Federal Home Loan Mortgage Corporation (FHLMC), and balloon mortgages with fixed-rate coupons. The Bloomberg Barclays US Municipal Index includes investment-grade, tax-exempt, and fixed-rate bonds with long-term maturities (greater than 2 years) selected from issues larger than $50 million.

Mark Gallagher is a financial advisor located at Gallagher Financial Services at 2586 East 7th Ave. Suite #304, North Saint Paul, MN 55109. He offers securities and advisory services as an Investment Adviser Representative of Commonwealth Financial Network®, Member FINRA/SIPC, a Registered Investment Adviser. He can be reached at 651-774-8759 or at mark@markgallagher.com.

© 2020 Commonwealth Financial Network ®