Weekly Market Update, May 15, 2017

Presented by Mark Gallagher

General market news
• The yield on the 10-year Treasury opened at 2.33 percent on May 15, after being as high as 2.42 percent the prior week. The yield fell in reaction to news that the U.S. Consumer Price Index rose 0.2 percent in April, a sign that inflation may be stabilizing. The 30-year yield also moved lower, settling around 3 percent.
• Markets were mixed last week. The S&P 500 snapped its streak of consecutive weekly gains at four, falling 0.26 percent. The Dow Jones Industrial Average also pulled back a modest 0.35 percent. The Nasdaq Composite fared better, rising 0.42 percent on strong earnings from Nvidia and news that Apple had surpassed $800 billion in market capitalization—the first company to do so.
• Despite many changes in the geopolitical environment over the past week, the markets seem complacent, as the CBOE Volatility Index (VIX) closed at its lowest level since 1993. The election of Moon Jae-in as president of South Korea and Emmanuel Macron as president of France yielded little reaction. Likewise, markets were unmoved by the surprise firing of FBI Director James Comey. Still, the decision has many questioning whether it will create additional headwinds for the new administration and its desired changes to health care and tax policies.
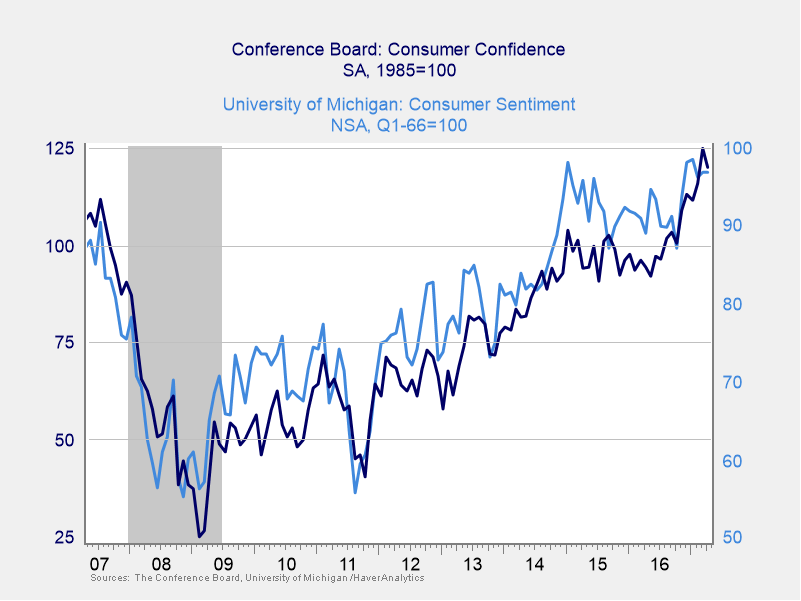
• Last week’s economic data, which focused primarily on consumers, was moderately positive. Retail sales data came in slightly below expectations, with month-over-month growth of 0.4 percent. Much of the increase was attributed to a healthy 0.7-percent uptick in auto sales. The University of Michigan Consumer Sentiment data surprised observers by moving higher despite expectations for no change. Consumer sentiment remains near highs last seen in the early 2000s. Combined with the rebound in auto sales and the elimination of weather-related headwinds, this data has analysts expecting significantly higher consumption growth in the second quarter.


Equity Index Week-to-Date Month-to-Date Year-to-Date 12-Month
S&P 500 –0.26% 0.40% 7.58% 18.30%
Nasdaq Composite 0.39% 1.33% 14.17% 30.76%
DJIA –0.35% –0.02% 6.69% 20.98%
MSCI EAFE 0.35% 2.17% 12.64% 17.18%
MSCI Emerging Markets 2.49% 2.57% 16.88% 27.65%
Russell 2000 –0.98% –1.20% 2.34% 26.52%

Source: Bloomberg


Fixed Income Index Month-to-Date Year-to-Date 12-Month
U.S. Broad Market –0.03% 1.56% 0.35%
U.S. Treasury –0.17% 1.20% –1.41%
U.S. Mortgages –0.05% 1.08% 0.33%
Municipal Bond 0.37% 2.69% –0.04%

Source: Morningstar Direct

What to look forward to
The housing market and industrial sector will dominate economic headlines this week.

On Monday, the National Association of Home Builders will release its Housing Market Index. This survey conveys homebuilders’ opinions on the health of the housing industry. It is expected to remain strong and steady at 68, which is close to the 12-year high it reached in March. Downside risks to this result include recent tariffs on Canadian lumber, which could raise costs substantially and hurt industry confidence.

Housing starts, a measure of new residential construction, will give us another read on this sector on Tuesday. Expectations are downbeat—for a decline to 1.125 million from 1.215 million—but a rise in building permits suggests this report could surprise to the upside.

The Industrial Production report, also released on Tuesday, is expected to show a 0.4-percent gain. Although down from the previous month, it would still be a healthy number. Solid gains in mining and manufacturing are expected to be offset by another decline in utilities output. Results could come in worse than expected, depending on how big that decline is. Manufacturing, which fell unexpectedly by 0.4 percent in March, is expected to reverse course with a 0.4-percent gain, based on an increase in employee hours worked. If the numbers come in as expected, this would be a reasonably healthy report.

Disclosures: Certain sections of this commentary contain forward-looking statements that are based on our reasonable expectations, estimates, projections, and assumptions. Forward-looking statements are not guarantees of future performance and involve certain risks and uncertainties, which are difficult to predict. All indices are unmanaged and are not available for direct investment by the public. Past performance is not indicative of future results. The S&P 500 is based on the average performance of the 500 industrial stocks monitored by Standard & Poor’s. The Nasdaq Composite Index measures the performance of all issues listed in the Nasdaq Stock Market, except for rights, warrants, units, and convertible debentures. The Dow Jones Industrial Average is computed by summing the prices of the stocks of 30 large companies and then dividing that total by an adjusted value, one which has been adjusted over the years to account for the effects of stock splits on the prices of the 30 companies. Dividends are reinvested to reflect the actual performance of the underlying securities. The MSCI EAFE Index is a float-adjusted market capitalization index designed to measure developed market equity performance, excluding the U.S. and Canada. The MSCI Emerging Markets Index is a market capitalization-weighted index composed of companies representative of the market structure of 26 emerging market countries in Europe, Latin America, and the Pacific Basin. The Russell 2000® Index measures the performance of the 2,000 smallest companies in the Russell 3000® Index. The Bloomberg Barclays US Aggregate Bond Index is an unmanaged market value-weighted performance benchmark for investment-grade fixed-rate debt issues, including government, corporate, asset-backed, and mortgage-backed securities with maturities of at least one year. The U.S. Treasury Index is based on the auctions of U.S. Treasury bills, or on the U.S. Treasury’s daily yield curve. The Bloomberg Barclays US Mortgage Backed Securities (MBS) Index is an unmanaged market value-weighted index of 15- and 30-year fixed-rate securities backed by mortgage pools of the Government National Mortgage Association (GNMA), Federal National Mortgage Association (Fannie Mae), and the Federal Home Loan Mortgage Corporation (FHLMC), and balloon mortgages with fixed-rate coupons. The Bloomberg Barclays US Municipal Index includes investment-grade, tax-exempt, and fixed-rate bonds with long-term maturities (greater than 2 years) selected from issues larger than $50 million.

###

Mark Gallagher is a financial advisor located at Gallagher Financial Services at 2586 East 7th Ave. Suite #304, North Saint Paul, MN 55109. He offers securities and advisory services as an Investment Adviser Representative of Commonwealth Financial Network®, Member FINRA/SIPC, a Registered Investment Adviser. He can be reached at 651-774-8759 or at mark@markgallagher.com.

Authored by the Investment Research team at Commonwealth Financial Network.

© 2017 Commonwealth Financial Network®

Market Update for the Month Ending April 30, 2017

Presented by Mark Gallagher

Mixed month for markets ends with gains
April was a volatile month for financial markets, but early declines turned to gains at the end. The S&P 500 Index, Dow Jones Industrial Average, and Nasdaq were up 1.03 percent, 1.45 percent, and 2.35 percent, respectively.

Markets were supported by improving fundamentals. At the end of April, the blended earnings growth rate for S&P 500 companies for the first quarter was 12.5 percent, according to FactSet. All three major U.S. indices stayed above their 200-day moving averages during April, which was a positive technical sign for markets as well.

Foreign equity markets fared even better. The MSCI EAFE Index rose 2.54 percent in April, and the MSCI Emerging Markets Index gained 2.21 percent. Technical indicators were also positive for both indices.

In the fixed income space, the Bloomberg Barclays Aggregate Bond Index ended the month with a 0.77-percent gain. The high-yield market also had a positive April, as the Bloomberg Barclays U.S. Corporate High Yield Index returned 1.15 percent.

Economy improves amid signs of slowing growth
Gross domestic product (GDP) growth for the first quarter was estimated at 0.7 percent. Although disappointing, slow growth in the first quarter has been the norm during the current recovery.

Consumer sentiment has improved substantially since last year’s election (see Figure 1). Recently, however, it has started to stabilize.


Figure 1. University of Michigan Consumer Sentiment and
Conference Board Consumer Confidence, 2007−2017

The ISM Manufacturing and Non-Manufacturing indices—important indicators of business sentiment—decreased slightly in April, but they remain at high levels. Durable goods orders, a proxy for business investment and therefore confidence, also increased.

Hard data lags soft numbers
Unfortunately, business and consumer optimism haven’t translated into real results. Consumer spending was disappointing in April. Retail sales dropped unexpectedly, and the previous month’s gain was revised to a loss. Weather and low gas prices played a role in the decline, but we need to see increases in consumer spending if we want faster growth.

On the business side, manufacturing output missed expectations and declined for the first time in seven months. In addition, results for the previous two months were revised down. Positive numbers from the last six months, however, indicate that the slowdown may be temporary.

The March employment number of 98,000 new jobs was quite weak. On the other hand, the unemployment rate and the underlying data surrounding wage growth were positive.

Housing continues to shine
Housing data came in largely better than expected in April. Home builder confidence is near post-recession highs, and an increase in building permits should lead to growth in new home supply. Existing and new home sales were also up more than expected.

Political risks continue to drive markets
In the U.S., the major political news was the Trump administration’s release of its first proposal for comprehensive tax reform. The plan includes a dramatically lower corporate tax rate, a change in the way companies are taxed on earnings in foreign countries, and fewer personal income tax brackets.

In Europe, the news was also dominated by politics. World stock markets bounced higher following first-round results in the French presidential election—widely seen as a referendum on the future of the European Union (EU). A strong EU proponent, Emmanuel Macron, is now favored to win the final election on May 7.

Meanwhile, tensions surrounding North Korea continue to escalate. So far, however, the U.S. and China appear to be working diplomatically to defuse the crisis.

Risks remain, but the future is bright
Despite real risks, the economic outlook for the rest of 2017 is solid. Multiyear highs in consumer sentiment, as well as the potential for looser regulations and tax reform, point toward the possibility of accelerated growth. How much this confidence will translate into increased spending remains to be seen. But the healthy job market and rising incomes indicate that this could happen sooner rather than later.

As always, the potential for shocks and instability continues. Therefore, a well-diversified portfolio designed around long-term needs remains the best strategy for meeting personal investing goals.

All information according to Bloomberg, unless stated otherwise.

Disclosure: Certain sections of this commentary contain forward-looking statements based on our reasonable expectations, estimates, projections, and assumptions. Forward-looking statements are not guarantees of future performance and involve certain risks and uncertainties, which are difficult to predict. Past performance is not indicative of future results. Diversification does not assure a profit or protect against loss in declining markets. All indices are unmanaged and investors cannot invest directly into an index. The S&P 500 Index is a broad-based measurement of changes in stock market conditions based on the average performance of 500 widely held common stocks. The Dow Jones Industrial Average is a price-weighted average of 30 actively traded blue-chip stocks. The Nasdaq Composite Index measures the performance of all issues listed in the Nasdaq Stock Market, except for rights, warrants, units, and convertible debentures. The MSCI EAFE Index is a float-adjusted market capitalization index designed to measure developed market equity performance, excluding the U.S. and Canada. The MSCI Emerging Markets Index is a market capitalization-weighted index composed of companies representative of the market structure of 26 emerging market countries in Europe, Latin America, and the Pacific Basin. It excludes closed markets and those shares in otherwise free markets that are not purchasable by foreigners. The Bloomberg Barclays Aggregate Bond Index is an unmanaged market value-weighted index representing securities that are SEC-registered, taxable, and dollar-denominated. It covers the U.S. investment-grade fixed-rate bond market, with index components for a combination of the Bloomberg Barclays government and corporate securities, mortgage-backed pass-through securities, and asset-backed securities. The Bloomberg Barclays U.S. Corporate High Yield Index covers the USD-denominated, non-investment-grade, fixed-rate, taxable corporate bond market. Securities are classified as high-yield if the middle rating of Moody’s, Fitch, and S&P is Ba1/BB+/BB+ or below.


Mark Gallagher is a financial advisor located at Gallagher Financial Services at 2586 East 7th Ave. Suite #304, North Saint Paul, MN 55109. He offers securities and advisory services as an Investment Adviser Representative of Commonwealth Financial Network®, Member FINRA/SIPC, a Registered Investment Adviser. He can be reached at 651-774-8759 or at mark@markgallagher.com.

Authored by Brad McMillan, senior vice president, chief investment officer, and Sam Millette, investment research associate, at Commonwealth Financial Network®.

© 2017 Commonwealth Financial Network®


Weekly Market Update, May 1, 2017

Presented by Mark Gallagher

General market news
• After hitting a recent low of 2.16 percent a little more than a week ago, the 10-year Treasury yield seems to be testing the 2.30-percent level again, but this time as a short-term ceiling. The 10-year was essentially flat last week, but the 30-year did move some, testing the 3-percent level after dropping as low as 2.82 percent the week before.
• A strong week of earnings and favorable reaction to the first round of the French election boosted global markets. The technology, health care, and consumer discretionary sectors led the way, with a number of big players in those spaces reporting positive earnings, including Amazon, Alphabet Inc., AstraZeneca, Bristol-Myers Squibb, and Amgen. In France, centrist Emmanuel Macron advanced to the final round of the presidential election, coming in ahead of Marine Le Pen.
• Last week began with a positive surprise from new home sales, which were expected to decline slightly to 588,000 in March but instead rose to 621,000. This uptick puts sales near post-recession highs and indicates that housing demand remains strong. Later in the week, durable goods orders increased by less than expected, though business investment remained healthy for the first quarter. To end the week, the first estimate of first-quarter GDP growth came in at 0.7 percent, as decelerating consumption and inventory buildup created a drag on the economy. Although the headline figure was disappointing, weather effects likely played a large part in slowing growth.


Equity Index Week-to-Date Month-to-Date Year-to-Date 12-Month
S&P 500 1.53% 1.03% 7.16% 17.32%
Nasdaq Composite 2.33% 2.35% 12.71% 27.39%
DJIA 1.91% 1.45% 6.71% 20.51%
MSCI EAFE 3.11% 2.62% 10.20% 11.53%
MSCI Emerging Markets 1.74% 2.21% 13.95% 19.04%
Russell 2000 1.50% 1.10% 3.59% 24.58%

Source: Bloomberg


Fixed Income Index Month-to-Date Year-to-Date 12-Month
U.S. Broad Market 0.77% 1.59% 0.83%
U.S. Treasury 0.69% 1.37% –0.65%
U.S. Mortgages 0.65% 1.13% 0.66%
Municipal Bond 0.73% 2.32% 0.14%

Source: Morningstar Direct

What to look forward to
The week is a busy one for economic news. On Monday, the personal income report for March is expected to show growth of 0.3 percent over February. (In February, incomes grew 0.4 percent.) This is a healthy level. Personal spending is also expected to improve, increasing to 0.2-percent growth in March, from 0.1 percent in February. Although this is low, it is helped by the fact that inflation is also low. If these reports come in as expected, they should support continued economic growth.

On Tuesday, the manufacturing sector will report its confidence level, which is expected to drop slightly from 57.2 in March to a still healthy 56.5. Numbers above 50 indicate expansion. The service sector will report on Wednesday; numbers there are expected to improve from 55.2 to 56.0, which again would signal a healthy outlook.

On Thursday, we expect to see that the international trade balance has worsened slightly, from a deficit of $43.6 billion in February to $45.2 billion in March. Despite this, the balance is not out of the ordinary and simply reflects a decline in industrial exports.

Finally, and most important, the jobs report will be released on Friday. It is expected to show significantly faster job growth, rising from 98,000 in March to 193,000 in April due to the arrival of warmer temperatures. Wage growth should also rise slightly, from 0.2 percent to 0.3 percent. If the data comes in as expected, this will reduce concerns about last month’s performance.

Disclosures: Certain sections of this commentary contain forward-looking statements that are based on our reasonable expectations, estimates, projections, and assumptions. Forward-looking statements are not guarantees of future performance and involve certain risks and uncertainties, which are difficult to predict. All indices are unmanaged and are not available for direct investment by the public. Past performance is not indicative of future results. The S&P 500 is based on the average performance of the 500 industrial stocks monitored by Standard & Poor’s. The Nasdaq Composite Index measures the performance of all issues listed in the Nasdaq Stock Market, except for rights, warrants, units, and convertible debentures. The Dow Jones Industrial Average is computed by summing the prices of the stocks of 30 large companies and then dividing that total by an adjusted value, one which has been adjusted over the years to account for the effects of stock splits on the prices of the 30 companies. Dividends are reinvested to reflect the actual performance of the underlying securities. The MSCI EAFE Index is a float-adjusted market capitalization index designed to measure developed market equity performance, excluding the U.S. and Canada. The MSCI Emerging Markets Index is a market capitalization-weighted index composed of companies representative of the market structure of 26 emerging market countries in Europe, Latin America, and the Pacific Basin. The Russell 2000® Index measures the performance of the 2,000 smallest companies in the Russell 3000® Index. The Bloomberg Barclays US Aggregate Bond Index is an unmanaged market value-weighted performance benchmark for investment-grade fixed-rate debt issues, including government, corporate, asset-backed, and mortgage-backed securities with maturities of at least one year. The U.S. Treasury Index is based on the auctions of U.S. Treasury bills, or on the U.S. Treasury’s daily yield curve. The Bloomberg Barclays US Mortgage Backed Securities (MBS) Index is an unmanaged market value-weighted index of 15- and 30-year fixed-rate securities backed by mortgage pools of the Government National Mortgage Association (GNMA), Federal National Mortgage Association (Fannie Mae), and the Federal Home Loan Mortgage Corporation (FHLMC), and balloon mortgages with fixed-rate coupons. The Bloomberg Barclays US Municipal Index includes investment-grade, tax-exempt, and fixed-rate bonds with long-term maturities (greater than 2 years) selected from issues larger than $50 million.


Mark Gallagher is a financial advisor located at Gallagher Financial Services at 2586 East 7th Ave. Suite #304, North Saint Paul, MN 55109. He offers securities and advisory services as an Investment Adviser Representative of Commonwealth Financial Network®, Member FINRA/SIPC, a Registered Investment Adviser. He can be reached at 651-774-8759 or at mark@markgallagher.com.

Authored by the Investment Research team at Commonwealth Financial Network.

© 2017 Commonwealth Financial Network®