Market Update for the Month Ending October 31, 2014

Presented by Mark Gallagher
October lives up to its scary reputation
October provided a roller-coaster ride for financial markets. The Dow Jones Industrial Average ended the month up 2.16 percent, after a drop of more than 5 percent mid-month, while the S&P 500 Index rose 2.44 percent, after a similar drop. The Nasdaq wound up best, posting a 3.06-percent gain, after declining more than 6 percent.

The drop in the middle of the month was caused by a confluence of worries, including the Ebola outbreak, bad economic news from around the world, and weaker-than-expected economic news here in the U.S. Much of the reaction in the financial markets seemed to come from fears that the bad news meant that this was the correction for which everyone had been waiting. In fact, however, with fundamentals continuing strong, most markets rallied after a short-lived pullback and closed October with gains.

Fundamentally, conditions remain healthy. Corporate earnings have been beating expectations—by October’s end, more than three-quarters of reporting companies had surpassed earnings expectations. Revenues have also grown faster than expected, with almost three out of five companies beating revenue expectations. Technically, the trend for U.S. markets remains positive, even with prices having dropped through the 200-day moving average mid-month. The strong recovery since then has brought prices back into a positive trend, and the break itself is not necessarily a danger sign.

Foreign markets showed trends similar to the U.S. market during October, although to different degrees. Developed markets, represented by the MSCI EAFE Index, dropped more than 7 percent mid-month and, despite a late-month recovery, still ended up with a 1.45-percent loss. Emerging markets, represented by the MSCI Emerging Markets Index, did better, with less than a 3-percent loss at mid-month and a 1.07-percent gain by month-end.

The relative underperformance of the developed markets was due to the continued slowing of European growth trends—a result of both the economic impact of sanctions on Russia and growing political conflict between France and Germany. Emerging markets, on the other hand, benefited from a drop in interest rates. Technically, the EAFE remained below its 200-day moving average, which suggested further weakness, while the Emerging Markets index moved back above that trend line, suggesting a resumption of a positive trend.

Fixed income markets also did well following a drop in interest rates, with the benchmark 10-year U.S. Treasury yield declining from 2.489 percent to 2.335 percent during the month. The Barclays Capital Aggregate Bond Index returned 0.98 percent for the month, while high-yield bonds, represented by the Barclays Capital U.S. Corporate High Yield Index, rose 1.19 percent. The drop in rates was due largely to continued declines in European government debt, which drove U.S. rates downward sharply, though they later recovered.

U.S. economic recovery accelerates
Despite the month’s market turbulence, the U.S. economic recovery continued to accelerate. After a disappointing August jobs report, the news that 248,000 jobs had been added in September and that the unemployment rate had dropped to 5.9 percent—close to 2004 levels— showed that the recovery was still intact. Other supporting news included the number of job openings, which reached a 13-year high, and initial jobless claims, which came in at their lowest level since 2000. Improving employment trends led both major consumer confidence measures to seven-year highs.

The Federal Reserve did its part to endorse the recovery by voting to end its bond-buying program and leaving the U.S. economy to stand on its own for the first time in years. Moreover, that move was quickly ratified by the announcement that the U.S. economy had grown at a 3.5-percent rate for the third quarter—above expectations.

Not all of the news was good. Sales of durables were down, which is somewhat worrisome, and consumer income and spending growth slowed. But the majority of the news supported an accelerating recovery. One data point, in particular, was encouraging at month-end. The employment cost index—a sign of pending wage growth—came in at a high for the second quarter in a row, suggesting that the final piece of the recovery, faster wage growth, may be on its way.

Also supporting growth during the month was a continuing decline in oil prices. As the graph shows, in October oil prices collapsed to levels seen only a couple of times in the past five years.


The Declining Price of Oil, May 15–October 31, 2014
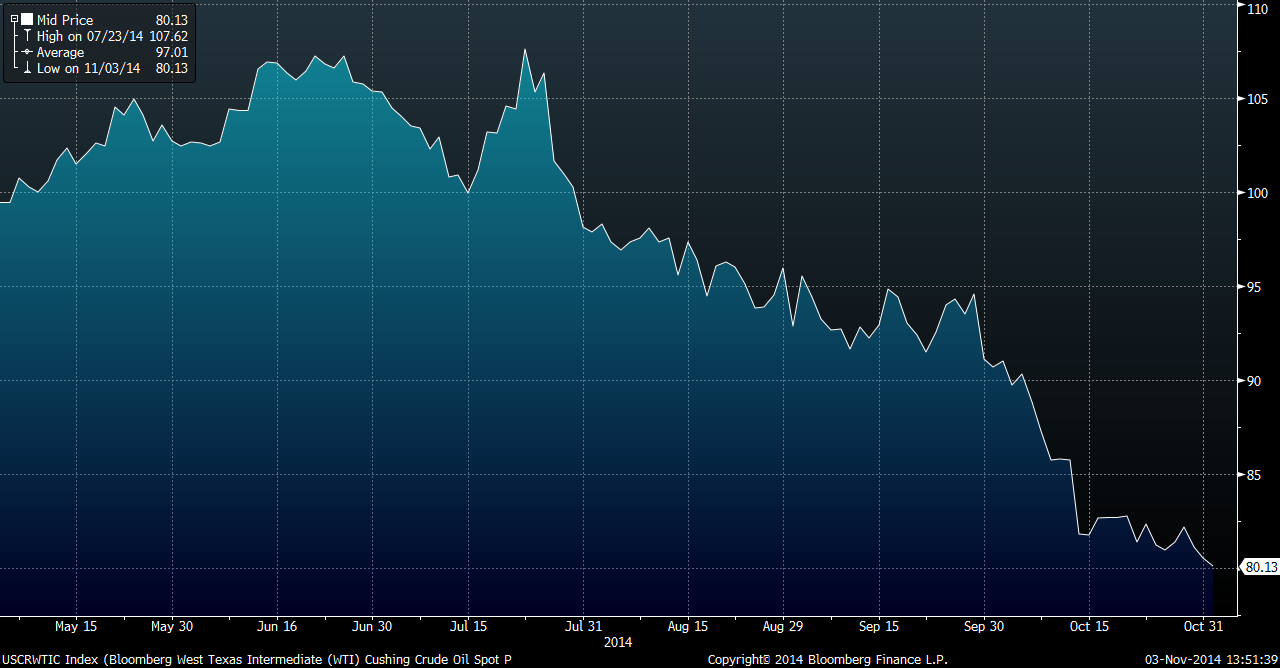
Oct Graph Market Update

Source: Bloomberg

The drop in oil prices could be a significant boost to U.S. growth. With a $10 change in the price of oil corresponding to roughly a 0.2-percent change in growth, the drop from $95 to $80 a barrel in October could add another 0.3 percent to growth in the next couple of quarters, on top of the already strong figures we now see.

Geopolitical turmoil strengthens the dollar
Continued oil price declines are quite possible, not only from a supply-and-demand perspective, but also as a result of a strengthening dollar. As the price of oil dropped over the past three months, the value of the dollar compared with other currencies increased.

A strong dollar helps hold down the prices of all imports, including oil and commodities, and strengthens the purchasing power of the U.S. consumer. The dollar’s appreciation comes from the growing strength of the U.S. economy, especially compared with the economies of other countries, as well as the Fed’s decision to stop buying bonds, even as Japan continues to do so and the prospect of the European Central Bank starting becomes more likely. With the Bank of Japan’s surprise decision at month-end to increase its bond purchases, and the ongoing economic troubles in Europe, continued dollar strength is likely, which should keep putting downward pressure on oil prices.

The downside of the strong dollar, however, is the probable negative effect on U.S. corporate earnings. Revenue from overseas, when translated to U.S. dollars, will be negatively affected, and this could be a headwind for earnings in the next couple of quarters. Overall, though, the net effect of a strong dollar could continue to benefit the economy and therefore the market.

Halloween much less scary than it might have been
October has historically been volatile, and the extreme price swings of almost all markets during the past month certainly lived up to that reputation. Despite the substantial drop in the middle of the month, though, the improving fundamentals of the U.S. economy and strong position of the U.S. internationally acted to cushion and ultimately reverse the decline.

Markets are inherently risky, and the volatility this month—even though we ended with a gain—should remind us that we will not always be so lucky. Risks remain around the world, and the trends from which we now benefit won’t always be there. It is important to stay focused on the long term and maintain a diversified portfolio that can ride out turbulence in both the short and medium terms.

Economic recovery in the U.S. has laid the foundation for continued profit gains for U.S. businesses, and economic growth has historically led to higher market valuations. This confluence of positive factors suggests that future results should be positive for investors and that the long-term perspective remains the correct one. Although volatility is still possible, and even likely, the longer-term perspective is still bright.

All information according to Bloomberg, unless stated otherwise.

Disclosure: Certain sections of this commentary contain forward-looking statements that are based on our reasonable expectations, estimates, projections, and assumptions. Forward-looking statements are not guarantees of future performance and involve certain risks and uncertainties, which are difficult to predict. Past performance is not indicative of future results. Diversification does not assure a profit or protect against loss in declining markets. All indices are unmanaged and investors cannot invest directly into an index. The Dow Jones Industrial Average is a price-weighted average of 30 actively traded blue-chip stocks. The S&P 500 Index is a broad-based measurement of changes in stock market conditions based on the average performance of 500 widely held common stocks. The Nasdaq Composite Index measures the performance of all issues listed in the Nasdaq Stock Market, except for rights, warrants, units, and convertible debentures. The MSCI EAFE Index is a float-adjusted market capitalization index designed to measure developed market equity performance, excluding the U.S. and Canada. The MSCI Emerging Markets Index is a market capitalization-weighted index composed of companies representative of the market structure of 26 emerging market countries in Europe, Latin America, and the Pacific Basin. It excludes closed markets and those shares in otherwise free markets that are not purchasable by foreigners. The Barclays Capital Aggregate Bond Index is an unmanaged market value-weighted index representing securities that are SEC-registered, taxable, and dollar-denominated. It covers the U.S. investment-grade fixed-rate bond market, with index components for a combination of the Barclays Capital government and corporate securities, mortgage-backed pass-through securities, and asset-backed securities. The Barclays Capital U.S. Corporate High Yield Index covers the USD-denominated, non-investment-grade, fixed-rate, taxable corporate bond market. Securities are classified as high-yield if the middle rating of Moody’s, Fitch, and S&P is Ba1/BB+/BB+ or below.

###

Mark Gallagher is a financial advisor located at Gallagher Financial Services at 2586 East 7th Avenue, North Saint Paul, MN 55109. He offers securities and advisory services as an Investment Adviser Representative of Commonwealth Financial Network®, Member FINRA/SIPC, a Registered Investment Adviser. He can be reached at 651-774-8759 or at mark@markgallagher.com
Authored by Brad McMillan, vice president, chief investment officer, at Commonwealth Financial Network.

© 2014 Commonwealth Financial Network®

Weekly Market Update, October 27, 2014

Presented by Mark Gallagher

General market news
• Equities were in rally mode last week, with the S&P 500 Index gaining 4.14 percent. The technology sector was particularly strong, helping to propel the Nasdaq Composite Index to a gain of 5.30 percent.
• Treasury yields stabilized last week after the roller-coaster ride the week before. The yield on the 10-year note began the week above 2.20 percent and remained north of that key mark, which we believe could be the lower support level. The 10-year yield opened this Monday morning at 2.27 percent, and the 30-year yield was above 3 percent again.
• One event that could have an impact on yields is the Federal Open Market Committee (FOMC) meeting on Wednesday, when the Fed is expected to announce the end of its quantitative easing program. This could put some downward pressure on yields, as it has the last three times the Fed pulled support.
• Just shy of the halfway point for earnings season, results are quite strong, with 72 percent of companies beating expectations. Earnings growth year-to-date is 9 percent over the first three quarters of 2013.


Equity Index Week-to-Date % Month-to-Date % Year-to-Date % 12-Month %
S&P 500 4.14% −0.29% 8.03% 14.45%
Nasdaq Composite 5.30% −0.19% 8.37% 15.57%
DJIA 2.62% −1.28% 3.26% 10.89%
MSCI EAFE 2.30% −3.70% −4.48% −3.18%
MSCI Emerging Markets 0.52% −2.25% 0.25% −2.11%
Russell 2000 3.38% 1.61% −2.87% 1.32%

Source: Bloomberg


Fixed Income Index Month-to-Date % Year-to-Date % 12-Month %
U.S. Broad Market 1.20% 5.61% 4.50%
U.S. Treasury 1.38% 5.09% 3.55%
U.S. Mortgages 1.04% 5.29% 4.05%
Municipal Bond 0.71% 9.11% 8.88%

Source: Bloomberg

What to look forward to
This week will feature several significant economic reports with the potential to impact markets. First, Durable Goods Orders, which have shown quite a bit of volatility recently, are expected to increase after dropping last month.

S&P/Case-Shiller Home Price Index data will be released Tuesday, with expectations for a rise in month-on-month home prices. This will be followed by the FOMC Rate Decision on Wednesday, when the Fed is expected to announce the end of its asset-purchasing program.

We will see the advance release of Third-Quarter GDP on Thursday, with expectations for a 3-percent growth rate over the quarter. The week will end with data on Personal Income and the University of Michigan Confidence indicator.

Disclosures: Certain sections of this commentary contain forward-looking statements that are based on our reasonable expectations, estimates, projections, and assumptions. Forward-looking statements are not guarantees of future performance and involve certain risks and uncertainties, which are difficult to predict. All indices are unmanaged and are not available for direct investment by the public. Past performance is not indicative of future results. The S&P 500 is based on the average performance of the 500 industrial stocks monitored by Standard & Poor’s. The Nasdaq Composite Index measures the performance of all issues listed in the Nasdaq Stock Market, except for rights, warrants, units, and convertible debentures. The Dow Jones Industrial Average is computed by summing the prices of the stocks of 30 large companies and then dividing that total by an adjusted value, one which has been adjusted over the years to account for the effects of stock splits on the prices of the 30 companies. Dividends are reinvested to reflect the actual performance of the underlying securities. The MSCI EAFE Index is a float-adjusted market capitalization index designed to measure developed market equity performance, excluding the U.S. and Canada. The MSCI Emerging Markets Index is a market capitalization-weighted index composed of companies representative of the market structure of 26 emerging market countries in Europe, Latin America, and the Pacific Basin. The Russell 2000® Index measures the performance of the 2,000 smallest companies in the Russell 3000® Index. The Barclays Capital Aggregate Bond Index is an unmanaged market value-weighted performance benchmark for investment-grade fixed-rate debt issues, including government, corporate, asset-backed, and mortgage-backed securities with maturities of at least one year. The U.S. Treasury Index is based on the auctions of U.S. Treasury bills, or on the U.S. Treasury’s daily yield curve. The Barclays Capital Mortgage-Backed Securities (MBS) Index is an unmanaged market value-weighted index of 15- and 30-year fixed-rate securities backed by mortgage pools of the Government National Mortgage Association (GNMA), Federal National Mortgage Association (Fannie Mae), and the Federal Home Loan Mortgage Corporation (FHLMC), and balloon mortgages with fixed-rate coupons. The Barclays Capital Municipal Bond Index includes investment-grade, tax-exempt, and fixed-rate bonds with long-term maturities (greater than 2 years) selected from issues larger than $50 million. The Barclays Capital U.S. Treasury Inflation Protected Securities (TIPS) Index measures the performance of intermediate (1- to 10-year) U.S. TIPS.

###
Mark Gallagher is a financial advisor located at Gallagher Financial Services at 2586 East 7th Avenue, North Saint Paul, MN 55109. He offers securities and advisory services as an Investment Adviser Representative of Commonwealth Financial Network®, Member FINRA/SIPC, a Registered Investment Adviser. He can be reached at 651-774-8759 or at mark@markgallagher.com

Authored by the Investment Research team at Commonwealth Financial Network.

© 2014 Commonwealth Financial Network®


Weekly Market Update, October 20, 2014

Presented by Mark Gallagher

General market news
• The past week has been an interesting one for the markets, to say the least. The 10-year Treasury opened last week with a yield just below 2.30 percent; by Wednesday, it had dropped to 1.86 percent before bouncing back to 2.19 percent late Friday and early this Monday morning. While a move back to 1.86 percent probably isn’t likely for the time being, the 2.20-percent level could certainly be a strong support.
• On October 29, at its second-to-last meeting of 2014, the Federal Reserve is set to end its quantitative easing program. It will be interesting to see how the financial markets react, as the end of quantitative easing in the past has had mixed implications.
• Volatility jumped dramatically in the equity markets last week, with large interday and intraday price swings. Wednesday’s action saw the S&P 500 decline as much as 57 points, putting it within basis points of a 10-percent correction, before rebounding to close down just 15 points for the day.


Equity Index Week-to-Date % Month-to-Date % Year-to-Date % 12-Month %
S&P 500 −1.00% −4.26% 3.73% 11.10%
Nasdaq Composite −0.41% −5.21% 2.92% 11.63%
DJIA −0.96% −3.80% 0.62% 9.02%
MSCI EAFE −1.95% −7.10% −7.85% −4.93%
MSCI Emerging Markets −1.93% −3.39% −0.93% −3.51%
Russell 2000 2.76% −1.72% −6.04% −0.52%

Source: Bloomberg


Fixed Income Index Month-to-Date % Year-to-Date % 12-Month %
U.S. Broad Market 1.47% 5.89% 5.12%
U.S. Treasury 1.76% 5.48% 4.19%
U.S. Mortgages 1.11% 5.37% 4.42%
Municipal Bond 1.24% 9.67% 10.41%

Source: Bloomberg

What to look forward to
This week will be relatively light in terms of key economic news. We will see data on Existing Home Sales, which are expected to increase after falling last month, as well as New Home Sales, which are expected to decrease.

The most important news of the week will be the Consumer Price Index data released on Wednesday, which will offer insight into inflation and possibly impact the Federal Reserve’s decision making in the future.

Disclosures: Certain sections of this commentary contain forward-looking statements that are based on our reasonable expectations, estimates, projections, and assumptions. Forward-looking statements are not guarantees of future performance and involve certain risks and uncertainties, which are difficult to predict. All indices are unmanaged and are not available for direct investment by the public. Past performance is not indicative of future results. The S&P 500 is based on the average performance of the 500 industrial stocks monitored by Standard & Poor’s. The Nasdaq Composite Index measures the performance of all issues listed in the Nasdaq Stock Market, except for rights, warrants, units, and convertible debentures. The Dow Jones Industrial Average is computed by summing the prices of the stocks of 30 large companies and then dividing that total by an adjusted value, one which has been adjusted over the years to account for the effects of stock splits on the prices of the 30 companies. Dividends are reinvested to reflect the actual performance of the underlying securities. The MSCI EAFE Index is a float-adjusted market capitalization index designed to measure developed market equity performance, excluding the U.S. and Canada. The MSCI Emerging Markets Index is a market capitalization-weighted index composed of companies representative of the market structure of 26 emerging market countries in Europe, Latin America, and the Pacific Basin. The Russell 2000® Index measures the performance of the 2,000 smallest companies in the Russell 3000® Index. The Barclays Capital Aggregate Bond Index is an unmanaged market value-weighted performance benchmark for investment-grade fixed-rate debt issues, including government, corporate, asset-backed, and mortgage-backed securities with maturities of at least one year. The U.S. Treasury Index is based on the auctions of U.S. Treasury bills, or on the U.S. Treasury’s daily yield curve. The Barclays Capital Mortgage-Backed Securities (MBS) Index is an unmanaged market value-weighted index of 15- and 30-year fixed-rate securities backed by mortgage pools of the Government National Mortgage Association (GNMA), Federal National Mortgage Association (Fannie Mae), and the Federal Home Loan Mortgage Corporation (FHLMC), and balloon mortgages with fixed-rate coupons. The Barclays Capital Municipal Bond Index includes investment-grade, tax-exempt, and fixed-rate bonds with long-term maturities (greater than 2 years) selected from issues larger than $50 million. The Barclays Capital U.S. Treasury Inflation Protected Securities (TIPS) Index measures the performance of intermediate (1- to 10-year) U.S. TIPS.

###

Mark Gallagher is a financial advisor located at Gallagher Financial Services at 2586 East 7th Avenue, North Saint Paul, MN 55109. He offers securities and advisory services as an Investment Adviser Representative of Commonwealth Financial Network®, Member FINRA/SIPC, a Registered Investment Adviser. He can be reached at 651-774-8759 or at mark@markgallagher.com

Authored by the Investment Research team at Commonwealth Financial Network.

© 2014 Commonwealth Financial Network®


Weekly Market Update, October 13, 2014

Presented by Mark Gallagher

General market news
• Equity markets suffered significant declines last week, led by a 4.45-percent drop in the Nasdaq and a 4.63-percent drop in the Russell 2000 Index. Poor earnings data, technical factors, and geopolitical concern all played a role in equity market weakness.
• The International Monetary Fund cut its forecast for global growth last week, which, combined with negative news out of Europe, led to the risk-off trade. Treasuries rallied as investors sought safety assets, despite the impending end of the Federal Reserve’s quantitative easing program.

Equity Index Week-to-Date % Month-to-Date % Year-to-Date % 12-Month %
S&P 500 −3.09% −3.29% 4.78% 14.94%
Nasdaq Composite −4.45% −4.82% 3.34% 15.14%
DJIA −2.70% −2.87% 1.60% 11.93%
MSCI EAFE −0.33% −3.23% −4.01% 1.95%
MSCI Emerging Markets 1.15% 0.34% 2.91% 2.20%
Russell 2000 −4.63% −4.36% −8.57% −0.22%

Source: Bloomberg


Fixed Income Index Month-to-Date % Year-to-Date % 12-Month %
U.S. Broad Market 1.02% 5.41% 5.29%
U.S. Treasury 1.17% 4.86% 4.16%
U.S. Mortgages 0.70% 4.94% 4.53%
Municipal Bond 0.83% 9.24% 9.96%

Source: Bloomberg


What to look forward to
Early in the week, we will see data related to producer inflation, with the release of the Producer Price Index. Later in the week, Retail Sales numbers are expected to decrease after a strong showing last month.

Industrial Production data will be released Thursday and should show an increase from previous readings. The week will end with Housing Starts, which are expected to rise after dropping last month.

Disclosures: Certain sections of this commentary contain forward-looking statements that are based on our reasonable expectations, estimates, projections, and assumptions. Forward-looking statements are not guarantees of future performance and involve certain risks and uncertainties, which are difficult to predict. All indices are unmanaged and are not available for direct investment by the public. Past performance is not indicative of future results. The S&P 500 is based on the average performance of the 500 industrial stocks monitored by Standard & Poor’s. The Nasdaq Composite Index measures the performance of all issues listed in the Nasdaq Stock Market, except for rights, warrants, units, and convertible debentures. The Dow Jones Industrial Average is computed by summing the prices of the stocks of 30 large companies and then dividing that total by an adjusted value, one which has been adjusted over the years to account for the effects of stock splits on the prices of the 30 companies. Dividends are reinvested to reflect the actual performance of the underlying securities. The MSCI EAFE Index is a float-adjusted market capitalization index designed to measure developed market equity performance, excluding the U.S. and Canada. The MSCI Emerging Markets Index is a market capitalization-weighted index composed of companies representative of the market structure of 26 emerging market countries in Europe, Latin America, and the Pacific Basin. The Russell 2000® Index measures the performance of the 2,000 smallest companies in the Russell 3000® Index. The Barclays Capital Aggregate Bond Index is an unmanaged market value-weighted performance benchmark for investment-grade fixed-rate debt issues, including government, corporate, asset-backed, and mortgage-backed securities with maturities of at least one year. The U.S. Treasury Index is based on the auctions of U.S. Treasury bills, or on the U.S. Treasury’s daily yield curve. The Barclays Capital Mortgage-Backed Securities (MBS) Index is an unmanaged market value-weighted index of 15- and 30-year fixed-rate securities backed by mortgage pools of the Government National Mortgage Association (GNMA), Federal National Mortgage Association (Fannie Mae), and the Federal Home Loan Mortgage Corporation (FHLMC), and balloon mortgages with fixed-rate coupons. The Barclays Capital Municipal Bond Index includes investment-grade, tax-exempt, and fixed-rate bonds with long-term maturities (greater than 2 years) selected from issues larger than $50 million. The Barclays Capital U.S. Treasury Inflation Protected Securities (TIPS) Index measures the performance of intermediate (1- to 10-year) U.S. TIPS.

###

Mark Gallagher is a financial advisor located at Gallagher Financial Services at 2586 East 7th Avenue, North Saint Paul, MN 55109. He offers securities and advisory services as an Investment Adviser Representative of Commonwealth Financial Network®, Member FINRA/SIPC, a Registered Investment Adviser. He can be reached at 651-774-8759 or at mark@markgallagher.com

Authored by the Investment Research team at Commonwealth Financial Network.

© 2014 Commonwealth Financial Network®