Market Update for the Month Ending February 28, 2022

Presented by Mark Gallagher

Markets Slide in February
Markets sold off in February, driven first by continued concerns about inflation and then by the Russian invasion of Ukraine. The S&P 500 dropped 2.99 percent while the Dow Jones Industrial Average was down 3.29 percent. The Nasdaq Composite Index was hit the hardest and its heavy weighting toward technology companies led to a 3.35 percent decline. This result marks two consecutive months with losses to start the year for all three indices.

Despite the selloff during the month, fundamentals showed continued improvement. According to Bloomberg Intelligence, as of February 25, with 95 percent of companies having reported actual fourth-quarter earnings, the average earnings growth rate for the S&P 500 was 28.5 percent. This is up notably from estimates for a 19.8 percent increase at the start of earnings season and shows that businesses continued to operate successfully despite rising medical risks. Since fundamentals drive market performance, the better-than-expected results in earnings is an encouraging sign for U.S. companies and markets.

Volatility turned technical factors for equities negative in February. All three major U.S. indices finished well below their respective 200-day moving averages, marking the first time all three indices have finished a month below trend since March 2020. The 200-day moving average is an important technical indicator, as prolonged breaks above or below this level can signal shifting investor sentiment for an index. This will be an important area to monitor to determine if investor sentiment has soured on U.S. markets or if the recent declines were a temporary market reaction to the rising risks to start the year.

The story was much the same internationally, with rising geopolitical risks taking center stage toward month-end. The MSCI EAFE Index declined 1.77 percent and emerging markets were hit even harder, with the MSCI Emerging Markets Index down 2.98 percent. Technicals were challenging for international markets as well. The indices ended below their respective 200-day moving averages, marking the second consecutive month where both finished below trend and eight consecutive months below trend for the MSCI Emerging Markets Index.

Even fixed income markets were down last month; however, this was primarily due to a mid-month rise in rates that was largely erased by month-end. The 10-year U.S. Treasury yield started at 1.81 percent, reached a high of 2.05 percent on February 15, and finished at 1.83 percent. The rate increase was largely a result of concerns regarding inflation and the Federal Reserve (Fed)’s anticipated rate hike in March, while the subsequent decline was driven by a flight to quality trade due to the Russian invasion. The Bloomberg U.S. Aggregate Bond Index ended down 1.12 percent.

High-yield fixed income, which is typically less driven by changes in interest rates and moves more in line with equities, also had a tough February. The Bloomberg U.S. High Yield Corporate Index dropped 1.03 percent. High-yield credit spreads widened to their highest month-end level since January 2021, indicating rising investor concern and demand for additional yield to invest in these riskier securities.

Risks Shift Throughout the Month
February saw rapid changes in the risks driving markets. Early on, declining medical risks helped support an equity market rebound following declines in January. At mid-month, though, concerns about inflation and the Fed’s plans for tighter monetary policy took center stage and rattled markets before the Russian invasion at month-end added more uncertainty.

We saw a significant decline in daily new Covid-19 cases and the 7-day moving average ended February at its lowest level since July 2021. This impressive decline in case growth was echoed by a similar decline in daily deaths and hospitalizations. With 65 percent of the country fully vaccinated and an additional 12 percent having received at least one shot—on top of growing natural immunity—last month’s improvement suggests that medical risks are likely to keep declining.

Despite the positive medical news, though, we then saw mid-month volatility driven by growing inflation, with the January Consumer Price Index (CPI) report showing consumer prices increasing at their fastest pace since 1982. Interest rates rose in anticipation of potentially faster monetary policy tightening from the Fed, and rising rates caused equity valuations to decline, contributing to the mid-month sell off.

The Russian invasion of Ukraine toward the end of the month caused increased uncertainty for markets—especially energy markets. While the invasion’s initial impact on U.S. equities was largely muted, the situation remains in flux and could cause more uncertainty and turbulence in the months ahead.

Ultimately, February’s shifts serve as a reminder that unexpected risks can suddenly appear and shake markets, generating significant volatility. Those risks, however, are not necessarily a good indicator of longer-term risks, or of underlying fundamental conditions.

Economic Data Improves
Despite market turmoil to start the year, February’s economic data continued to get better. The January employment report showed 467,000 jobs were added during the month, which was much better than the 125,000 that were expected. The November and December jobs reports were also revised up a net 709,000 new jobs. Many more jobs than expected is good news and should help maintain the high levels of consumer demand and economic momentum we need to ride out the current headwinds.

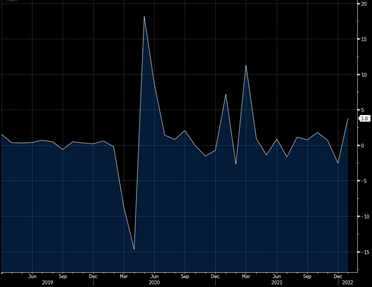
Supported by strong employment data, consumer spending also showed signs of improvement. Both personal spending and retail sales came in above expectations in January, largely offsetting declines from December that were caused by the spread of the Omicron variant. Retail sales increased 3.8 percent during the month while personal spending grew 2.1 percent. As you can see in Figure 1, this represents the best month for retail sales growth since March 2021 when federal stimulus checks spurred a surge in spending. January’s rebound in consumer spending was another encouraging signal that the momentum from 2021 carried over into the new year and continued to drive economic growth.

Figure 1. Retail Sales Monthly Percentage Change, March 2019-Present

Business confidence and spending also showed signs of continued economic growth during the month. Business confidence declined slightly to start the year, but remained in healthy expansionary territory. Core durable goods orders, which are often viewed as a proxy for business investment, increased by more than expected in January, marking 11 consecutive months with increased business spending. Businesses spent much of 2021 hiring and investing in equipment to try and meet high levels of consumer demand, and this trend appears to have continued into the new year.

The housing sector also showed signs of continued improvement during the month. Home builder confidence remained in healthy expansionary territory in February, driven by continually high levels of potential home buyer demand. January’s existing home sales report also showed faster-than-expected sales growth to start the year, and the annual pace of existing home sales hit a one-year high in January. The resilience for the housing market despite the headwinds created by Omicron and inflation at the start of the year was impressive and highlights the continued strength for the important housing sector.

Risks Remain but Growth Is Likely
As we saw in February, very real risks for markets and the economy remain. The ongoing war between Russia and Ukraine will be a major factor for political and economic uncertainty, even if the direct economic and market impact has been relatively muted in the U.S. thus far. Additionally, while we saw medical risks drop in February, we could see new waves of Covid-19 in the months ahead. Finally, inflation is high and, with the war, may increase further. While the current uncertainty may slow the Fed’s response, higher inflation could push rates even higher and lead to more market uncertainty and volatility if the central bank surprises investors.

The fundamentals for businesses and the economy, however, remain strong and show continued signs of improvement. While negative headlines and geopolitical events can draw investor attention and lead to short-term selloffs, the improving fundamentals should support markets and the economy though periods of uncertainty. Given the potential for short-term volatility, it’s important to remember a well-diversified portfolio that matches investor timelines and goals remains the best path forward for most investors. As always, if you have concerns, reach out to your financial advisor to review your financial plans.

All information according to Bloomberg, unless stated otherwise.

Disclosure: Certain sections of this commentary contain forward-looking statements based on our reasonable expectations, estimates, projections, and assumptions. Forward-looking statements are not guarantees of future performance and involve certain risks and uncertainties, which are difficult to predict. Past performance is not indicative of future results. Diversification does not assure a profit or protect against loss in declining markets. All indices are unmanaged and investors cannot invest directly into an index. The Dow Jones Industrial Average is a price-weighted average of 30 actively traded blue-chip stocks. The S&P 500 Index is a broad-based measurement of changes in stock market conditions based on the average performance of 500 widely held common stocks. The Nasdaq Composite Index measures the performance of all issues listed in the Nasdaq Stock Market, except for rights, warrants, units, and convertible debentures. The MSCI EAFE Index is a float-adjusted market capitalization index designed to measure developed market equity performance, excluding the U.S. and Canada. The MSCI Emerging Markets Index is a market capitalization-weighted index composed of companies representative of the market structure of 26 emerging market countries in Europe, Latin America, and the Pacific Basin. It excludes closed markets and those shares in otherwise free markets that are not purchasable by foreigners. The Bloomberg Aggregate Bond Index is an unmanaged market value-weighted index representing securities that are SEC-registered, taxable, and dollar-denominated. It covers the U.S. investment-grade fixed-rate bond market, with index components for a combination of the Bloomberg government and corporate securities, mortgage-backed pass-through securities, and asset-backed securities. The Bloomberg U.S. Corporate High Yield Index covers the USD-denominated, non-investment-grade, fixed-rate, taxable corporate bond market. Securities are classified as high-yield if the middle rating of Moody’s, Fitch, and S&P is Ba1/BB+/BB+ or below.

Mark Gallagher is a financial advisor located at Gallagher Financial Services at 2586 East 7th Ave. Suite #304, North Saint Paul, MN 55109. He offers securities and advisory services as an Investment Adviser Representative of Commonwealth Financial Network®, Member FINRA/SIPC, a Registered Investment Adviser. He can be reached at 651-774-8759 or at mark@markgallagher.com.

Authored by the Investment Research team at Commonwealth Financial Network.
© 2022 Commonwealth Financial Network®


Weekly Market Update, February 22, 2022

Presented by Mark Gallagher

General Market News
• The U.S. Treasury curve saw yields decline modestly on the short end and remained mostly flat on the longer end last week. The 2- and 5-year U.S. Treasury yields were down 11 basis points (bps), ending the week at 1.47 percent and 1.84 percent, respectively. The 10- and 30-year U.S. Treasury yields were down 7 bps (to 1.96 percent) and 1 bp (to 2.3 percent), respectively. On Monday, Federal Reserve (Fed) Governor Michelle Bowman expressed an open mind around the idea of a 50-bps hike. There are still numerous senior Fed officials, however, who are signaling opposition to a half-percentage-point increase. Investors will be on the lookout for more clues and clearer sentiment as the March 15–16 meeting inches closer.
• U.S. and developed international markets sold off last week as geopolitical tensions and the case for higher rates continued. The week began with a hotter-than-expected Producer Price Index report on Tuesday, followed by a strong January retail sales report on Wednesday. Also released on Wednesday was the Federal Open Market Committee (FOMC) meeting minutes, which indicated a dovish tone (although the meeting was held prior to the more recent inflationary, retail spending, and employment data). Consumer staples and materials were the top-performing sectors while energy, communications services, and financials were among the worst performers. Tensions between NATO members and Russia rose over the build-up of Russian troops on the Ukrainian border. There was some hope as Biden agreed to a French-brokered summit with Russian President Vladimir Putin and investors preferred to take a risk-off trade approach.
• On Tuesday, the Producer Price Index for January was released. Producer prices increased more than expected, with headline producer prices increasing 1 percent against calls for a 0.5 percent increase. On a year-over-year basis, producer prices rose 9.7 percent in January, down modestly from the 9.8 percent year-over-year inflation from December but higher than economist estimates for a 9.1 percent annual growth rate. Core producer prices, which strip out the impact of volatile food and energy prices, increased 0.8 percent during the month and 8.3 percent year-over-year, once again beating economist estimates. Producer prices faced notable inflationary pressure throughout much of 2021, driven by tangled global supply chains and rising material and labor costs, and this report shows that these inflationary pressures remained to start the new year.
• On Wednesday, the January retail sales report was released. Retail sales rebounded more than expected to start the year after a drop in sales in December. The report showed that retail sales increased 3.8 percent, which was better than economist estimates for a 2 percent increase. This marks the best month for retail sales growth since March 2021, when an infusion of federal stimulus checks spurred a surge in spending. This encouraging result, following a downwardly revised 2.5 percent decline in sales in December, indicates that the slowdown in sales at year-end was likely a temporary lull caused by rising medical risks. Given the swift return to sales growth in January, this report served as an encouraging sign that the economic impact from the Omicron variant was relatively benign compared with earlier Covid-19 waves. Looking ahead, continued improvements on the medical front may support spending growth in the months ahead, which would be a good sign for the pace of the overall recovery.
• Wednesday saw the release of the January industrial production report. Industrial production increased 1.4 percent, which was higher than economist estimates for a 0.5 percent increase. This strong result was supported by a surge in heating demand during the month, which caused utilities output to increase nearly 10 percent. Improving public health and reopened factories also supported the increase in production, as capacity utilization increased from 76.6 percent in December to 77.6 percent in January against calls for a more modest increase to 76.8 percent. This brought utilization to its highest level since early 2019, which is another encouraging sign that the economic impact from the Omicron variant was muted compared with earlier waves. Manufacturing output increased 0.2 percent, which was in line with expectations. Overall, this report showed a solid rebound for production to start the new year.
• The third major data release on Wednesday was the release of the National Association of Home Builders Housing Market Index for February. This widely monitored measure of home builder confidence declined slightly, dropping from 83 in January to 82. This was in line with economist estimates and still signals relatively high levels of home builder confidence. This is a diffusion index, where values above 50 indicate growth, so this result still signals continued new home construction ahead. Home builder confidence and new home construction rebounded swiftly following the expiration of initial lockdowns and have remained in expansionary territory since, supported by high levels of home buyer demand and low supply of homes available for sale. The drop in home builder confidence was partially due to a drop in the measure of prospective home buyer foot traffic, which could be a sign that rising home prices and mortgage rates are starting to serve as a headwind for future sales growth.
• The final major release on Wednesday was the release of the FOMC meeting minutes from the January Fed meeting. The Fed did not make any changes to interest rates at this meeting, but economists were still interested in seeing the minutes due to the expectation that the Fed would start hiking interest rates at its next meeting in March. The minutes showed consensus among Fed members that the economic recovery has reached a point where it will soon be appropriate to start tightening monetary policy in earnest. The Fed’s bond purchase program is set to expire in March, and the central bank is widely expected to increase the federal funds rate by at least 25 basis points at its mid-March meeting. The minutes also showed that some Fed members believed the central bank could start to shrink its balance sheet later in the year, which would be another step toward normalizing monetary policy. Although the anticipated tightening actions from the Fed would be a welcome sign that the central bank views the economy as largely healthy, any changes to monetary policy could lead to market volatility and should be monitored.
• We finished the week with Friday’s release of the January existing home sales report. Existing home sales surged past expectations, with sales increasing 6.7 percent against calls for a 1.3 percent decline. Although part of this increase was due to a downward revision to the December sales level, this better-than-expected result brought the pace of existing home sales to a one-year high. The gains were widespread, with all three geographical regions seeing faster growth during the month, but a lack of supply likely held back faster sales growth. The supply of homes available for sale declined 2.3 percent, which brought year-over-year supply down 16.5 percent. The surge in existing home sales is yet another signal that the economic recovery continued at pace to start the year. With that being said, some of the better-than-expected growth was likely due to prospective home buyers scrambling to purchase ahead of potentially rising mortgage rates. Looking ahead, the low supply of homes for sale, rising prices, and rising mortgage rates are expected to serve as headwinds for faster sales growth.

Equity Index Week-to-Date Month-to-Date Year-to-Date 12-Month
S&P 500 –1.52% –3.58% –8.57% 12.90%
Nasdaq Composite –1.73% –4.79% –13.32% –1.72%
DJIA –1.77% –2.82% –5.97% 10.24%
MSCI EAFE -1.86% 0.67% –4.20% 2.43%
MSCI Emerging Markets –0.67% 2.00% 0.07% –12.04%
Russell 2000 –1.00% –0.87% –10.42% –10.46%

Source: Bloomberg, as of February 18, 2022

Fixed Income Index Month-to-Date Year-to-Date 12-Month
U.S. Broad Market –1.56% –3.68% –3.43%
U.S. Treasury –1.15% –3.03% –2.89%
U.S. Mortgages –1.42% –2.89% –3.61%
Municipal Bond –0.61% –3.33% –2.10%

Source: Morningstar Direct, as of February 18, 2022

What to Look Forward To
On Tuesday, the Conference Board Consumer Confidence survey for February was released. This widely followed measure of consumer confidence declined by slightly less than expected during the month. The report showed that the index fell from 113.8 in January to 110.5 in February against calls for a drop to 110. This marks two consecutive months with declining consumer confidence; however, the index is still well above the pandemic-era low of 85.7 that we saw during initial lockdowns. The current decline is largely due to continued consumer concern about high levels of inflation, as well as lowered consumer expectations for future economic growth and increased consumer inflation expectations. Historically, improving confidence has helped support faster consumer spending growth, so this will continue to be a closely monitored report.

Speaking of consumer spending, on Friday, the January personal income and personal spending reports are set to be released. Personal spending is set to increase 1.4 percent during the month, which would echo the rebound in retail sales growth that we saw to start the year. Personal spending declined 0.6 percent in December, so any improvement in January would be an encouraging sign that consumer demand and spending rebounded swiftly to start the new year after the December lull. Personal income has been volatile throughout the course of the pandemic, as shifting federal stimulus and unemployment payments have caused large monthly swings in average income levels. Economists expect to see personal income decline 0.3 percent to start the year, following a 0.3 percent increase in December. The anticipated decline in personal income to start the year is due to the expiration of monthly child tax credits at the end of 2021; however, looking forward, the tight labor market is expected to support rising incomes.

We’ll finish the week with the release of the preliminary estimate of the January durable goods orders report on Friday. Headline orders are expected to increase 1 percent during the month, following a 0.7 percent decline in December. The anticipated increase in January is due, in part, to a rebound in volatile aircraft orders. With that being said, core durable goods orders, which strip out the impact of transportation orders, are expected to increase 0.3 percent in January after rising 0.6 percent in December. Core durable goods orders are often viewed as a proxy for business investment; if estimates hold, this would mark 11 consecutive months with rising core orders. Business confidence and spending were strong throughout most of 2021, and the anticipated continued expansion in January would be a sign that business momentum from 2021 carried over into the new year despite headwinds created by the Omicron variant and persistent inflationary pressure.

Disclosures: Certain sections of this commentary contain forward-looking statements that are based on our reasonable expectations, estimates, projections, and assumptions. Forward-looking statements are not guarantees of future performance and involve certain risks and uncertainties, which are difficult to predict. All indices are unmanaged and are not available for direct investment by the public. Past performance is not indicative of future results. The S&P 500 is based on the average performance of the 500 industrial stocks monitored by Standard & Poor’s. The Nasdaq Composite Index measures the performance of all issues listed in the Nasdaq Stock Market, except for rights, warrants, units, and convertible debentures. The Dow Jones Industrial Average is computed by summing the prices of the stocks of 30 large companies and then dividing that total by an adjusted value, one which has been adjusted over the years to account for the effects of stock splits on the prices of the 30 companies. Dividends are reinvested to reflect the actual performance of the underlying securities. The MSCI EAFE Index is a float-adjusted market capitalization index designed to measure developed market equity performance, excluding the U.S. and Canada. The MSCI Emerging Markets Index is a market capitalization-weighted index composed of companies representative of the market structure of 26 emerging market countries in Europe, Latin America, and the Pacific Basin. The Russell 2000® Index measures the performance of the 2,000 smallest companies in the Russell 3000® Index. The Bloomberg US Aggregate Bond Index is an unmanaged market value-weighted performance benchmark for investment-grade fixed-rate debt issues, including government, corporate, asset-backed, and mortgage-backed securities with maturities of at least one year. The U.S. Treasury Index is based on the auctions of U.S. Treasury bills, or on the U.S. Treasury’s daily yield curve. The Bloomberg US Mortgage Backed Securities (MBS) Index is an unmanaged market value-weighted index of 15- and 30-year fixed-rate securities backed by mortgage pools of the Government National Mortgage Association (GNMA), Federal National Mortgage Association (Fannie Mae), and the Federal Home Loan Mortgage Corporation (FHLMC), and balloon mortgages with fixed-rate coupons. The Bloomberg US Municipal Index includes investment-grade, tax-exempt, and fixed-rate bonds with long-term maturities (greater than 2 years) selected from issues larger than $50 million. One basis point is equal to 1/100th of 1 percent, or 0.01 percent.

Mark Gallagher is a financial advisor located at Gallagher Financial Services at 2586 East 7th Ave. Suite #304, North Saint Paul, MN 55109. He offers securities and advisory services as an Investment Adviser Representative of Commonwealth Financial Network®, Member FINRA/SIPC, a Registered Investment Adviser. He can be reached at 651-774-8759 or at mark@markgallagher.com.
Authored by the Investment Research team at Commonwealth Financial Network.

© 2022 Commonwealth Financial Network®

Is the Stock Market Poised for a Crash?

Presented by Mark Gallagher

With the recent market pullback, investor concerns are starting to mount. To be sure, there is plenty to worry about—the Omicron wave, inflation, interest rates, and a potential war in Ukraine, just to name a few. Given all the things that could go wrong, is a stock market crash an inevitable outcome?

To help answer that question, we first need to consider where stock prices come from. From there, we can determine what would have to happen for some of the worst-case scenarios to become reality. And once we have that figured out? We can decide how realistic we think those events are (or not).

Unpacking Stock Prices
So, where exactly do stock prices come from? Here, there are two things that matter: earnings and how much investors will pay for those earnings (i.e., valuations).

Earnings. Earnings, of course, come from companies, which come from people working and spending. Right now, the job market is very healthy from an employee’s standpoint, with a shortage of workers and consequent pay increases, and that has helped keep consumer spending growing. From an employer’s perspective, of course, that is a cost. But that too has a good side, as businesses are selling a lot to those spenders and are being forced to invest since they can’t hire.

Between consumer spending and business investment, earnings are expected to keep rising through 2022. Other things being equal, the market responds to changes in earnings. If earnings go up, the markets rise. Given the way the economy is growing, it likely won’t be a drop in earnings that takes the market down this year.

Valuations. So, if a market drop will not be about earnings, then it has to be about valuations. Here, you can tell a pretty convincing story. As of this writing (January 24, 2022), stock prices for the S&P 500 companies are now at about 20 times the earnings expected in the next year. In 2007, just before the financial crisis, stocks were at about 15 times the next year’s expected earnings. If we revert to the 2007 valuation level, this would imply that another 25 percent drop in the market is possible from here. During the financial crisis itself, moreover, stocks dropped to a valuation level of about 10, which would imply another 50 percent decline from here. Using historical data, we can get to that 50 percent decline prediction.

But recent experience has been different. Valuations are tied to interest rates, and rates have been lower since the financial crisis—usually much lower. This has allowed stock valuations to drift higher. If we look at more recent data from Yardeni Research outside of the depths of crises (since, say 2013, when the post-financial crisis recovery really got going), we see something different. Here, the lowest valuation level is about 14 times, and most of the post-2016 data has been at 16 times or higher. Even the market collapse at the start of the pandemic bottomed out at about 14 times. In other words, with rates low, valuations have been sustainably much higher since the financial crisis.

If we take 14 as a bottom for valuations, that could imply another 30 percent downside from here. But that would require another serious systemic crisis, and the problems we have now don’t even begin to approach the ones we had then. If we take the more normal 16 times valuation as a bottom for normal worry levels, that could result in another 20 percent drop from here. As a reasonable worst case, absent another systemic crisis, this makes sense.

Is This Normal?
As of this writing (January 24, 2022), the S&P 500 is down a bit more than 10 percent from the all-time high. The Nasdaq is down a bit more, at almost 17 percent. These are meaningful drawbacks, and it makes sense to want to react. They are also, however, perfectly normal volatility, which we see in the markets pretty much every year. So far, at least, this is normal market behavior and a rational response to the very real risks we summarized at the start. With everything that is going on, it makes sense for markets to pull back a bit, and that is what we are seeing.

As the worst-case numbers above indicate, markets might well drop more, as the perceived risks rise. That too would be reasonable, and it is something we have seen in recent history. But absent some kind of systemic shock, as long as earnings stay solid and interest rates remain in the range we have seen in the five years before the pandemic, stock prices are likely to have a solid foundation over time. That solid foundation also suggests that when those worries subside, valuations and stock prices can bounce back reasonably quickly, as we saw in 2020, 2018, and indeed after the financial crisis itself.

The Stock Market Is Not Crashing
This analysis shows a market crash remains unlikely, which is good. But more important, it shows what would have to happen to get a crash. Some kind of systemic crisis would do it. So would a collapse of the economy, knocking earnings down. Finally, if interest rates were to spike up and stay there, we could well see valuations drop sharply. A crash could happen, but this is what would have to precede it.

And this is the context we should be considering when we look at those predictions of a crash. Are any of those happening? We will keep watching for them, but so far the answer is no. So, while the market can and almost certainly will show occasional sharp drops, as long as the economy continues to grow and interest rates stay at the levels we saw from 2015 to 2019, the foundations remain solid.

Certain sections of this commentary contain forward-looking statements that are based on our reasonable expectations, estimates, projections, and assumptions. Forward-looking statements are not guarantees of future performance and involve certain risks and uncertainties, which are difficult to predict. All indices are unmanaged and are not available for direct investment by the public. Past performance is not indicative of future results. The S&P 500 is based on the average performance of the 500 industrial stocks monitored by Standard & Poor’s. The Nasdaq Composite Index measures the performance of all issues listed in the Nasdaq Stock Market, except for rights, warrants, units, and convertible debentures.

Mark Gallagher is a financial advisor located at Gallagher Financial Services at 2586 East 7th Ave. Suite #304, North Saint Paul, MN 55109. He offers securities and advisory services as an Investment Adviser Representative of Commonwealth Financial Network®, Member FINRA/SIPC, a Registered Investment Adviser. He can be reached at 651-774-8759 or at mark@markgallagher.com.
Authored by the Investment Research team at Commonwealth Financial Network.
© 2022 Commonwealth Financial Network®

Weekly Market Update, January 18, 2022

Presented by Mark Gallagher

General Market News
• The yield curve saw modest flattening last week. The short end of the curve continued its move higher and the long end of the curve held steady. The U.S. 2-year Treasury yield increased another 9.7 basis points (bps), closing at 0.967 percent. The 10-year Treasury yield increased 0.6 bps while the 30-year Treasury yield actually fell 0.2 bps. This news may indicate that the move in yields is approaching a near-term ceiling as appetite from investors keeps bond yields in check at this level. We will see if this trend continues and expands to the short end of the curve in the future.
• Global equity markets showed mixed performance last week as investors questioned whether we saw peak inflation with Wednesday and Thursday’s Consumer Price Index (CPI) and Producer Price Index (PPI) reports. The Nasdaq Composite Index outperformed the Dow Jones Industrial Average despite the Russell 1000 Growth underperforming the Russell 1000 Value 1.03 percent. Elsewhere, the MSCI EAFE outperformed the S&P 500 and MSCI Emerging Markets Index outperformed all areas, posting a gain of 2.57 percent. Dollar weakness and a potential rate ceiling helped the region. Energy was a standout performer as West Texas Intermediate crude rose 6.2 percent. Communication services and technology also performed well as growth stocks rallied. The worst-performing sectors were REITs, consumer discretionary, and utilities.
• On Wednesday, the CPI report for December was released. Consumer prices rose 0.5 percent, down from the 0.8 percent increase we saw in November but slightly above economist estimates. On a year-over-year basis, consumer prices increased 7 percent in December, which was in line with expectations. This represents the highest level of year-over-year consumer inflation since 1982. Core consumer prices, which strip out volatile food and energy prices, rose 0.6 percent in December and 5.5 percent on a year-over-year basis. This was slightly higher than economist estimates for a 0.5 percent monthly and 5.4 percent year-over-year increase. Consumer prices experienced upward pressure throughout 2021, fueled by high levels of pent-up consumer demand, thin business inventories, and tangled global supply chains. Looking forward, the Federal Reserve (Fed) is expected to focus on combating inflation in 2022 as the central bank works to normalize monetary policy.
• Thursday saw the release of the PPI report for December. Producer prices increased 0.2 percent, down notably from the revised 1 percent increase we saw in November and below estimates for a 0.4 percent increase. On a year-over-year basis, producer prices increased 9.7 percent in December, which was slightly below estimates for a 9.8 percent rise. Core producer prices, which strip out the impact of volatile food and energy prices, increased 0.5 percent in December and 8.3 percent on a year-over-year basis. Similar to consumer prices, producer prices have been pressured this year due to supply chain constraints. Producers have also had to contend with rising material and labor costs, which contributed to the increase in inflationary pressure throughout the year.
• On Friday, the December retail sales report was released. Retail sales were disappointing, as headline sales dropped 1.9 percent against calls for a more modest 0.1 percent decline. This marks the first month with declining sales since July, and it’s a sign that rising medical risks and inflationary pressure weighed on consumer spending to finish the year. The declines were widespread, as 10 of the 13 categories in the report showed a drop in sales, led by an 8.7 percent drop in nonstore sales. Core retail sales, which strip out the impact of auto and gas sales, fell 2.5 percent against calls for a 0.2 percent decline. Despite the miss against expectations in December, earlier strength in consumer spending growth throughout the quarter and year helped blunt some of the disappointment from this report. This will be a widely monitored release in the coming months, given the importance of consumer spending on the pace of the overall economic recovery.
• We finished the week with Friday’s release of the preliminary estimate of the University of Michigan consumer sentiment survey for January. Consumer sentiment fell more than expected to start the new year, dropping from 70.6 in December to 68.8 to start January against calls for a drop to 70. This result, which brought the index close to its recent low of 67.4, signals continued consumer unease. The larger-than-expected drop was largely due to a decline in the future expectations subindex. Future expectations declined, in part, due to rising inflation expectations, as 1-year and 5-year consumer inflation expectations increased, despite messaging from the Fed that the central bank is committed to combating inflation in the new year. The current conditions subindex also declined, which was likely due to the rise in case growth we’ve seen because of the Omicron variant.

Equity Index Week-to-Date Month-to-Date Year-to-Date 12-Month
S&P 500 –0.29% –2.11% –2.11% 25.49%
Nasdaq Composite –0.28% –4.79% –4.79% 15.32%
DJIA –0.88% –1.13% –1.13% 18.71%
MSCI EAFE 0.18% 0.10% –0.11% 9.22%
MSCI Emerging Markets 2.57% 1.84% 2.09% –5.41%
Russell 2000 –0.79% –3.67% –3.67% 2.86%

Source: Bloomberg, as of January 14, 2022

Fixed Income Index Month-to-Date Year-to-Date 12-Month
U.S. Broad Market –1.82% –1.82% –2.60%
U.S. Treasury –1.77% –1.77% –3.00%
U.S. Mortgages –1.49% –1.49% –2.53%
Municipal Bond –0.93% –0.93% 0.56%

Source: Morningstar Direct, as of January 14, 2022

What to Look Forward To
On Tuesday, the National Association of Home Builders Housing Market Index for January was released. Home builder confidence dropped modestly to start the year, as the index fell from 84 in December to 83 in January against calls for no change. This is a diffusion index, where values above 50 indicate expansion, so this result signals continued construction growth despite the decline. Home builder confidence has remained in solid expansionary territory following the expiration of initial lockdowns in 2020. Since then, high levels of home buyer demand and a lack of homes for sale have supported faster construction growth. Home builder confidence sits well above pre-pandemic levels, signaling more construction growth in the months ahead. The continued strength of home builder confidence is impressive, given the headwinds caused by rising material and labor costs for home builders. Today’s report indicates a healthy housing sector to start the new year.

Speaking of new home construction, Wednesday will see the release of the December building permit and housing starts reports. These measures of new home construction are expected to show a modest decline, following larger-than-anticipated increases in November. Permits are set to drop 0.7 percent in December, after rising 3.6 percent in November. Starts are set to go down 1.7 percent, following an 11.8 percent surge in November. These reports can be quite volatile on a month-to-month basis. Throughout the pandemic, however, the pace of new home construction has remained above pre-pandemic levels. Record-low mortgage rates and a desire for more space due to the pandemic have supported a surge in home buyer demand. Because existing homeowners were hesitant to put their homes up for sale, newly built homes sold quickly throughout 2021.

We’ll finish the week with Thursday’s release of the December existing homes sales report. Existing home sales are set to decline 0.8 percent, following a better-than-expected 1.9 percent increase in November. Still, the pace of sales is expected to remain well above pre-pandemic levels despite the anticipated drop. In fact, if estimates prove accurate, existing home sales would be up 12.6 percent on an annual basis, compared with the pre-pandemic high recorded in February 2020. Looking forward, the low supply of homes for sale as well as rising prices and mortgage rates may serve as a headwind for significantly faster growth of existing home sales. If we continue to see sales near current levels, however, they would signal a healthy housing sector.

Disclosures: Certain sections of this commentary contain forward-looking statements that are based on our reasonable expectations, estimates, projections, and assumptions. Forward-looking statements are not guarantees of future performance and involve certain risks and uncertainties, which are difficult to predict. All indices are unmanaged and are not available for direct investment by the public. Past performance is not indicative of future results. The S&P 500 is based on the average performance of the 500 industrial stocks monitored by Standard & Poor’s. The Nasdaq Composite Index measures the performance of all issues listed in the Nasdaq Stock Market, except for rights, warrants, units, and convertible debentures. The Dow Jones Industrial Average is computed by summing the prices of the stocks of 30 large companies and then dividing that total by an adjusted value, one which has been adjusted over the years to account for the effects of stock splits on the prices of the 30 companies. Dividends are reinvested to reflect the actual performance of the underlying securities. The MSCI EAFE Index is a float-adjusted market capitalization index designed to measure developed market equity performance, excluding the U.S. and Canada. The MSCI Emerging Markets Index is a market capitalization-weighted index composed of companies representative of the market structure of 26 emerging market countries in Europe, Latin America, and the Pacific Basin. The Russell 2000® Index measures the performance of the 2,000 smallest companies in the Russell 3000® Index. The Bloomberg US Aggregate Bond Index is an unmanaged market value-weighted performance benchmark for investment-grade fixed-rate debt issues, including government, corporate, asset-backed, and mortgage-backed securities with maturities of at least one year. The U.S. Treasury Index is based on the auctions of U.S. Treasury bills, or on the U.S. Treasury’s daily yield curve. The Bloomberg US Mortgage Backed Securities (MBS) Index is an unmanaged market value-weighted index of 15- and 30-year fixed-rate securities backed by mortgage pools of the Government National Mortgage Association (GNMA), Federal National Mortgage Association (Fannie Mae), and the Federal Home Loan Mortgage Corporation (FHLMC), and balloon mortgages with fixed-rate coupons. The Bloomberg US Municipal Index includes investment-grade, tax-exempt, and fixed-rate bonds with long-term maturities (greater than 2 years) selected from issues larger than $50 million. One basis point is equal to 1/100th of 1 percent, or 0.01 percent.

Mark Gallagher is a financial advisor located at Gallagher Financial Services at 2586 East 7th Ave. Suite #304, North Saint Paul, MN 55109. He offers securities and advisory services as an Investment Adviser Representative of Commonwealth Financial Network®, Member FINRA/SIPC, a Registered Investment Adviser. He can be reached at 651-774-8759 or at mark@markgallagher.com.
Authored by the Investment Research team at Commonwealth Financial Network.

© 2020 Commonwealth Financial Network®