Presented by Mark Gallagher
Solid July for Markets
July was a positive month for most markets despite rising medical risks. The three major U.S. indices saw all-time highs as the Nasdaq Composite gained 1.19 percent, the Dow Jones Industrial Average notched a 1.34 percent gain, and the S&P 500 led the way with a 2.38 percent return.
These positive returns coincided with more good news on the earnings front. According to Bloomberg Intelligence as of July 30, the second-quarter blended earnings growth rate for the S&P 500 was 89 percent (with 59 percent of companies reporting results). This year-over-year growth compares to when initial lockdowns suppressed earnings last year, but the current rate is higher than analyst estimates of a 65.9 percent increase at the start of earnings seasons. Better-than-expected earnings growth has been widespread across every sector in the index. Fundamentals drive long-term performance, so continued growth is a good sign for markets.
Technical factors also supported domestic markets as all three indices remained above their respective 200-day moving averages for the 13th consecutive month. Prolonged breaks above or below the 200-day moving average can indicate shifting investor sentiment for an index; this continued technical support is an encouraging sign that despite medical risks, investors remain confident in the ongoing economic recovery in the U.S.
Although performance was generally solid across domestic markets, the story was mixed on the international side. The MSCI EAFE Index experienced some volatility but was able to manage a 0.75 percent gain for the month. Rising medical risks due to the Delta variant spooked emerging investors; the MSCI Emerging Markets Index ended July down by 6.67 percent.
From a technical perspective, the MSCI EAFE Index remained well above its 200-day moving average throughout the month, marking nine straight months with continued technical support for developed international markets. The MSCI Emerging Markets Index fell midway through the month, ending below its trend line and breaking a 12-month streak of finishing above the 200-day moving average. This could be a sign of more risk for emerging markets going forward.
Fixed income markets also had a strong July as falling interest rates caused bond prices to rise. The 10-year U.S. Treasury yield fell from 1.48 percent at the start of the month to 1.24 percent at month-end. This marks the lowest month-end level for the 10-year yield since January as rising concerns about the Delta variant led some investors to seek the relative safety of fixed income. The Bloomberg Barclays U.S. Aggregate Bond Index ended the month with a 1.12 percent gain.
High-yield fixed income—typically less tied to interest rate movements—had a slightly muted month, with the Bloomberg Barclays U.S. Corporate High Yield Index increasing by 0.38 percent. High-yield credit spreads widened modestly during the month, a sign that investors were becoming slightly more cautious.
Medical Risks Rising but Still Contained
Despite noted progress on the public health front throughout most of the year, medical risks increased in July, driven in large part by the Delta variant. This more contagious form of the novel coronavirus led to more infections throughout the month as the average number of daily new cases grew by roughly five times in July. We’ve also seen a concerning upsurge in the amount of COVID-related hospitalizations, with the total number of hospitalized patients reaching a five-month high.
While overall numbers have deteriorated, so far case numbers are concentrated in a handful of states. The majority of the country still has the virus largely under control, which should limit the national impact. Behaviors such as seeking vaccinations and mask wearing—as we saw in previous waves—are becoming more prevalent in many areas, and there are signs the increase may be slowing. This is something we need to watch closely, but the most likely course of events is for the resurgence to once again be brought under control.
Economic Recovery Slowing but Solid
Although medical risks certainly rose during the month, the impact of those risks on the economic recovery is likely to be muted compared with last spring. With outbreaks limited by area, nationwide shutdowns appear unnecessary; even localized shutdowns in the most affected areas remain unlikely. In the absence of such shutdowns, the economy will remain open and growing.
Even though growth is likely to continue, there are signs it may be slowing. Labor market recovery has decelerated as layoffs remained stubbornly high in July and started to climb toward month-end following previous improvements. We’ve also seen business confidence pull back from record-high levels earlier in the year as rising uncertainty weighed on business owners.
Despite some data deterioration, however, the economy still has substantial momentum and continued growth remains the most likely path forward. Consumer confidence remains very strong despite rising medical risks, with the Conference Board Consumer Confidence Index increasing by more than expected in July. This result brought the overall level of consumer confidence in line with pre-pandemic levels, which should help support continued consumer spending growth following better-than-expected boosts for both retail sales and personal spending in June. Given the importance of consumer spending on the overall economy, the continually high level of consumer confidence and spending growth is a good sign for the pace of economic recovery.
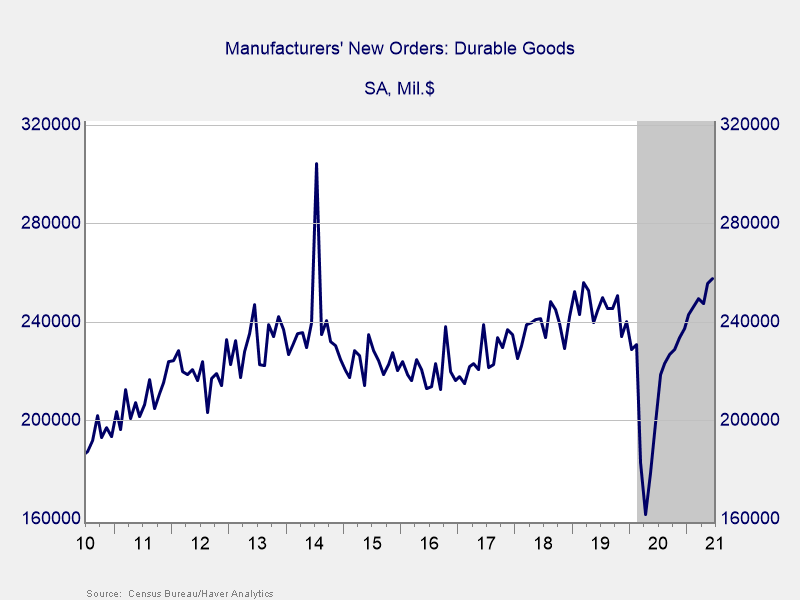
Also encouraging is business confidence—while below recent highs, it’s still at very healthy levels, which should support continued business spending and investment. As you can see in Figure 1, the total level of durable goods orders has recovered past pre-pandemic levels, indicating a healthy recovery for business spending since the expiration of initial lockdowns last year.
Figure 1. Durable Goods Orders, 2010–Present
The fundamentals are still positive as both consumers and businesses remain confident—and spending—despite rising risks. As long as most of the country remains open, growth should continue even if we do see some slowing.
Rising Risks Indicate Caution Is Warranted
Despite rising medical risks, we are still in a much better place as a country on both the public health and economic fronts than we were even a couple of months ago. That said, July also reminds us that real risks to recovery remain. Though the spike in medical risks during the month has not yet caused significant economic or market impact, those risks should be closely monitored. The key question looking forward will be whether rising localized infection rates lead to another national wave of infection growth. It does represent a very real risk to acknowledge and watch, however unlikely it currently appears.
Aside from rising medical risks, we have normal risks as well. Continued negotiations on the size and scope of the potential infrastructure deal from Washington have caused uncertainty. Looming in the near future is the fact that Congress needs to address the federal debt limit, which could lead to a potential government shutdown as early as October. These political risks are not necessarily immediate concerns; however, uncertainty has the potential to weigh on investors and markets in the months ahead.
While these and other risks may prompt increased ambiguity and instability in the months ahead, it’s important to focus on the bigger picture over a long-term horizon. A well-diversified portfolio that matches goals and timelines remains the best path forward for most investors. If you have concerns, reach out to your financial advisor to review your financial plan.
All information according to Bloomberg, unless stated otherwise.
Disclosure: Certain sections of this commentary contain forward-looking statements based on our reasonable expectations, estimates, projections, and assumptions. Forward-looking statements are not guarantees of future performance and involve certain risks and uncertainties, which are difficult to predict. Past performance is not indicative of future results. Diversification does not assure a profit or protect against loss in declining markets. All indices are unmanaged and investors cannot invest directly into an index. The Dow Jones Industrial Average is a price-weighted average of 30 actively traded blue-chip stocks. The S&P 500 Index is a broad-based measurement of changes in stock market conditions based on the average performance of 500 widely held common stocks. The Nasdaq Composite Index measures the performance of all issues listed in the Nasdaq Stock Market, except for rights, warrants, units, and convertible debentures. The MSCI EAFE Index is a float-adjusted market capitalization index designed to measure developed market equity performance, excluding the U.S. and Canada. The MSCI Emerging Markets Index is a market capitalization-weighted index composed of companies representative of the market structure of 26 emerging market countries in Europe, Latin America, and the Pacific Basin. It excludes closed markets and those shares in otherwise free markets that are not purchasable by foreigners. The Bloomberg Barclays Aggregate Bond Index is an unmanaged market value-weighted index representing securities that are SEC-registered, taxable, and dollar-denominated. It covers the U.S. investment-grade fixed-rate bond market, with index components for a combination of the Bloomberg Barclays government and corporate securities, mortgage-backed pass-through securities, and asset-backed securities. The Bloomberg Barclays U.S. Corporate High Yield Index covers the USD-denominated, non-investment-grade, fixed-rate, taxable corporate bond market. Securities are classified as high-yield if the middle rating of Moody’s, Fitch, and S&P is Ba1/BB+/BB+ or below.
Mark Gallagher is a financial advisor located at Gallagher Financial Services at 2586 East 7th Ave. Suite #304, North Saint Paul, MN 55109. He offers securities and advisory services as an Investment Adviser Representative of Commonwealth Financial Network®, Member FINRA/SIPC, a Registered Investment Adviser. He can be reached at 651-774-8759 or at mark@markgallagher.com.
Authored by the Investment Research team at Commonwealth Financial Network.
© 2020 Commonwealth Financial Network ®