Presented by Mark Gallagher
Positive June Caps Off Strong Quarter for Markets
Equity markets rallied in June, which capped off a positive month and quarter for all three major U.S. indices. Both the S&P 500 and Nasdaq Composite hit record highs in June before pulling back slightly toward month-end. The S&P 500 gained 2.33 percent in June and 8.55 percent for the quarter. The Nasdaq rose by 5.55 percent during the month and 9.68 percent for the quarter. The Dow Jones Industrial Average was held back by poor results from a few constituents during the month, but it managed to gain 0.02 percent in June and 5.08 percent for the quarter.
These strong results coincided with improved fundamentals. According to Bloomberg Intelligence, as of June 25, the expected second-quarter earnings growth rate for the S&P 500 is 59.2 percent. This follows a 45.8 percent year-over-year increase in earnings in the first quarter. While part of the large year-over-year growth can be attributed to comparisons to last year’s lockdown-influenced earnings, we saw better-than-expected earnings growth in the first quarter and positive revisions in the second quarter. The anticipated further growth is a positive sign for markets, as fundamentals ultimately drive long-term performance.
Technical factors were also supportive for markets during the month and quarter. All three major U.S. indices remained well above their respective 200-day moving average throughout the period. This marks 12 straight months where the indices have ended above trend. Prolonged breaks above or below the 200-day moving average can signal a shift in investor sentiment for an index. So, the continued technical support was a positive sign for U.S. equity markets.
International markets also saw solid results for the quarter. Some volatility in June held back overall performance compared with the U.S., however. The MSCI EAFE Index declined by 1.13 percent during the month, but it managed to return a respectable 5.17 percent for the quarter. The MSCI Emerging Markets Index held up a bit better with a 0.21 percent increase in June that contributed to a 5.12 percent gain for the quarter. Both indices were well supported technically, spending the entire period above their respective trend lines.
Even fixed income had a strong second quarter, as declining long-term interest rates helped support fixed income markets. The 10-year U.S. Treasury yield ended the quarter at 1.45 percent, which was down from 1.69 percent at the start of the quarter. The Bloomberg Barclays U.S. Aggregate Bond Index gained 0.70 percent in June and 1.83 percent in the second quarter. High-yield fixed income, which is typically less tied to changes in interest rates, also saw gains during the month and quarter. The Bloomberg Barclays U.S. Corporate High Yield Bond Index increased by 1.34 percent in June and 2.74 percent during the quarter. High-yield spreads declined throughout the quarter, as investors continued to favor higher-yielding, riskier securities.
Pandemic’s Economic Impact Fades
Although the pandemic continues as an ongoing medical risk, from an economic and market perspective, the worst appears to be behind us. We made steady progress throughout the month and quarter in containing the spread of the coronavirus, with continued vaccine progress driving much of the improvement.
The number of new daily cases fell to its lowest point since the start of the pandemic by the end of June, and we saw similar progress with hospitalizations and deaths throughout the quarter. While concerns remain about localized outbreaks, the high vaccination rates throughout the country make another national outbreak unlikely. We ended the quarter with more than half of the country having received at least one vaccine shot, and more than 46 percent of Americans have now been fully vaccinated.
The big risk as we close out the first half of the year remains the introduction of more contagious versions of the virus, notably the Delta variant. As that spreads, especially in areas with lower vaccination rates, there is the potential for medical risks to rise in the future, but for the time being, they remain largely contained.
Economic Recovery Picks Up Steam
The progress on the medical front allowed for continued reopening efforts, and we finished the quarter with almost all of the country open again. This helped support a faster economic recovery, as we saw job growth accelerate in May after a lull in April. Layoffs declined in June while job openings continued to grow. In a positive sign for the labor market recovery, we ended the month with layoffs at their lowest weekly level since the start of the pandemic.
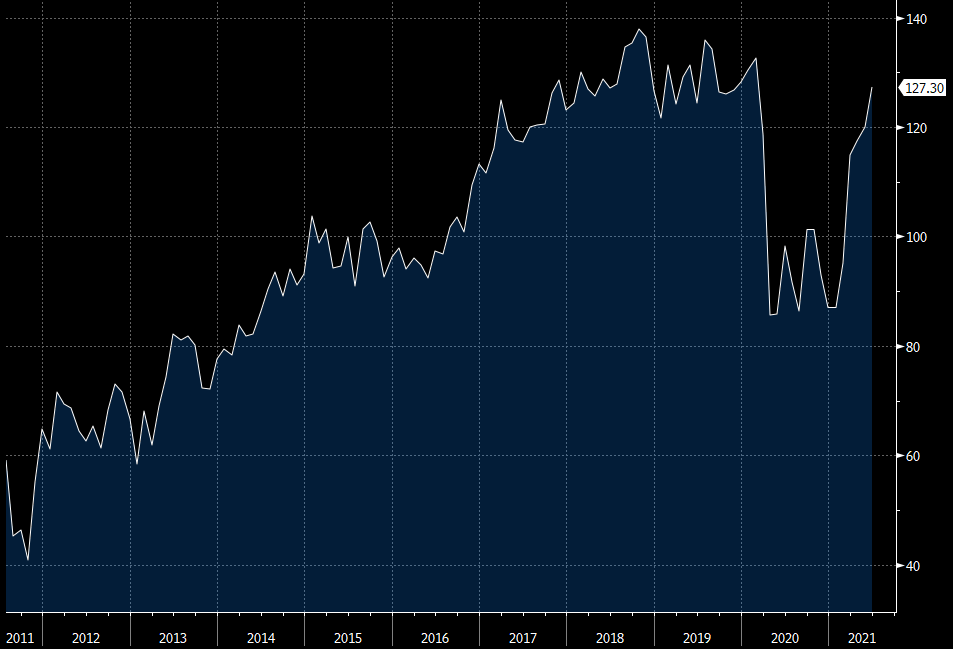
Consumer confidence and spending also showed signs of improvement during the month and quarter, with both now sitting back near pre-pandemic levels. The improvement was especially impressive for consumer confidence. As you can see in Figure 1, the Conference Board Consumer Confidence Index hit a 16-month high in June and now sits near pre-pandemic highs. The strong level of consumer confidence is expected to help support faster consumer spending growth in the months ahead, which, in turn, should help support the continued economic recovery.
Figure 1. Conference Board Consumer Confidence, 2011–Present
Businesses also showed signs of faster growth throughout the quarter, driven by high levels of consumer demand and the easing of state and local restrictions. Service sector confidence increased to a record high in May, and we saw similar improvements for manufacturer confidence. The Institute for Supply Management Composite index, which combines service sector and manufacturer confidence, remains well above pre-pandemic levels. High levels of business confidence supported healthy business spending and hiring throughout the month and quarter, which is expected to continue into the months ahead.
Risks Remain Despite Progress
Despite the continued progress, there are some areas of concern. On the medical side, the Delta variant and slowing vaccination rates pushed off the likely date of herd immunity and raised the chances of medical disruptions. On the economic side, the problems were more immediate and largely generated by the success of the recovery so far. Labor shortages are becoming a concern as people hesitate before returning to work, which has driven wages higher. Similarly, gaps in supply chains have pushed material costs up. Between these two factors, both producer and consumer prices have seen upward pressure, resulting in fears about inflation.
Another area of concern is the housing sector, which showed signs of stress during the month. Rising home prices served as a headwind for faster sales growth in May, as high levels of home buyer demand and low supply of homes for sale caused sales of existing homes to decline for the fourth month in a row. Up until recently, housing had been one of the bright spots in the economic recovery, as low mortgage rates and shifting home buyer preferences due to the pandemic supported a surge in demand. Looking forward, the low inventory of homes for sale and rising prices may hold back the pace of overall sales growth. But if sales remain near current levels, it would still signal an improvement compared with the pace of pre-pandemic home sales.
Finally, political risks remain and should be recognized. Domestically, all eyes are on Washington, where negotiations around a potential infrastructure bill continue in earnest. Any additional stimulus spending would likely be seen as a tailwind for the economic recovery, but the size and scope of any new spending remain uncertain. Internationally, risks remain as well, especially in countries that have not made as much progress as the U.S. with the pandemic.
These problems, however, are largely symptoms of the recovery so far here in the U.S. and are being solved as we speak. Despite them, we ended the month with both the medical news and the economy in the best place since the start of the pandemic. But while the path forward looks bright, it also remains uncertain, which could lead to market volatility in the months ahead. Given that, a well-diversified portfolio that matches investor goals and timelines remains the best path forward for most. If concerns remain, reach out to your advisor to discuss your financial plan.
All information according to Bloomberg, unless stated otherwise.
Disclosure: Certain sections of this commentary contain forward-looking statements based on our reasonable expectations, estimates, projections, and assumptions. Forward-looking statements are not guarantees of future performance and involve certain risks and uncertainties, which are difficult to predict. Past performance is not indicative of future results. Diversification does not assure a profit or protect against loss in declining markets. All indices are unmanaged and investors cannot invest directly into an index. The Dow Jones Industrial Average is a price-weighted average of 30 actively traded blue-chip stocks. The S&P 500 Index is a broad-based measurement of changes in stock market conditions based on the average performance of 500 widely held common stocks. The Nasdaq Composite Index measures the performance of all issues listed in the Nasdaq Stock Market, except for rights, warrants, units, and convertible debentures. The MSCI EAFE Index is a float-adjusted market capitalization index designed to measure developed market equity performance, excluding the U.S. and Canada. The MSCI Emerging Markets Index is a market capitalization-weighted index composed of companies representative of the market structure of 26 emerging market countries in Europe, Latin America, and the Pacific Basin. It excludes closed markets and those shares in otherwise free markets that are not purchasable by foreigners. The Bloomberg Barclays Aggregate Bond Index is an unmanaged market value-weighted index representing securities that are SEC-registered, taxable, and dollar-denominated. It covers the U.S. investment-grade fixed-rate bond market, with index components for a combination of the Bloomberg Barclays government and corporate securities, mortgage-backed pass-through securities, and asset-backed securities. The Bloomberg Barclays U.S. Corporate High Yield Index covers the USD-denominated, non-investment-grade, fixed-rate, taxable corporate bond market. Securities are classified as high-yield if the middle rating of Moody’s, Fitch, and S&P is Ba1/BB+/BB+ or below.
Mark Gallagher is a financial advisor located at Gallagher Financial Services at 2586 East 7th Ave. Suite #304, North Saint Paul, MN 55109. He offers securities and advisory services as an Investment Adviser Representative of Commonwealth Financial Network®, Member FINRA/SIPC, a Registered Investment Adviser. He can be reached at 651-774-8759 or at mark@markgallagher.com.
Authored by the Investment Research team at Commonwealth Financial Network.
© 2020 Commonwealth Financial Network ®