Weekly Market Update, July 6, 2020

Presented by Mark Gallagher

General Market News
• The 10-year Treasury yield opened at 0.68 percent on Monday, while the 30-year opened at 1.44 percent and the 2-year at 0.15 percent. The 10-year and shorter part of the yield curve remain lower as uncertainty and near-term concerns about the economy linger. Meanwhile, the 10- to 20-year portion of the curve has become steeper, as there has been an influx of new supply.
• With a number of economic measures helping fuel optimism in the economy, U.S. equities held a strong rally last week in the face of rising COVID-19 cases. As we will cover below, June’s Institute for Supply Management (ISM) Manufacturing index and employment reports surprised to the upside. We also saw positive early study results from a joint effort by Pfizer (PFE) and BioNTech SE (BNTX) to develop a coronavirus vaccine. Lastly, we saw the release of the minutes of the June Federal Open Market Committee (FOMC) meeting, at which the board stated there was a substantial likelihood of additional waves. The FOMC announced it has continued to purchase corporate bonds from names such as AT&T (T), UnitedHealth Group (UNH), and Walmart (WMT). Sectors that outperformed last week included communication services, REITs, and materials. Lagging sectors included financials, energy, and consumer staples.
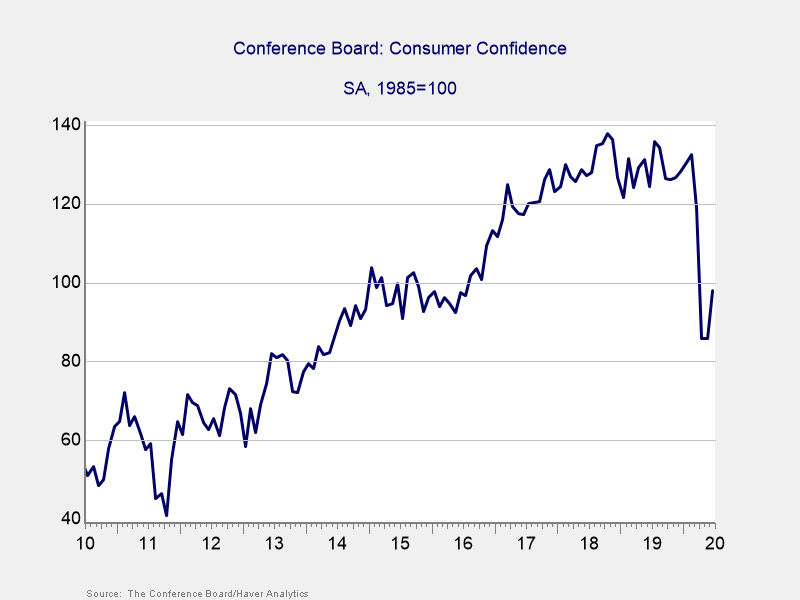
• We started last week with Tuesday’s release of the Conference Board Consumer Confidence Index for June. Confidence rose from 86.6 in May to 98.1 in June, against expectations for a more modest increase to 91.5. This improvement, the best single-month increase for the index since 2011, helps calm concerns about rising case counts affecting consumer confidence. Increased confidence levels support faster consumer spending growth, so this was a very encouraging sign for June’s consumer spending reports and overall economic growth in the second quarter.
• On Wednesday, the ISM Manufacturing index for June was released. This measure of manufacturing sector confidence rose from 43.1 in May to 52.6 in June, against forecasts for a more modest increase to 49.8. This was the largest single-month increase for the index in nearly 40 years, bringing manufacturer confidence to a 14-month high. This is a diffusion index, where values greater than 50 indicate expansion, so this better-than-expected result bodes well for manufacturing output during the month. Many factories began to reopen in late May and early June, boosting confidence after forced closures in April brought the index to its lowest level since the 2008 financial crisis. Ultimately, this result points toward a faster-than-expected recovery for the manufacturing sector, which was hit hard by anticoronavirus measures.
• We finished the holiday-shortened week with Thursday’s release of the June employment report. Approximately 4.8 million jobs were added during the month, far better than economist estimates for slightly more than 3.2 million. This marks the second consecutive month in which headline job creation was far above economist estimates, indicating that once reopening efforts took hold, the pace of economic recovery was faster than expected. The underlying data was positive as well, with the unemployment rate falling from 13.3 percent in May to 11.1 percent in June, against forecasts for a more modest fall to 12.5 percent. The labor force participation rate also increased while the underemployment rate fell. In summary, this was a very strong employment report that showed reopening efforts spurred more hiring than anticipated, and that supports hopes for a faster-than-expected economic recovery.

Equity Index Week-to-Date Month-to-Date Year-to-Date 12-Month
S&P 500 4.07% 0.98% –2.13% 6.57%
Nasdaq Composite 4.64% 1.49% 14.35% 26.22%
DJIA 3.29% 0.10% –8.34% –1.83%
MSCI EAFE 1.48% 1.37% –10.13% –5.19%
MSCI Emerging Markets 3.65% 3.98% –6.19% –0.64%
Russell 2000 3.90% –0.65% –13.54% –7.57%

Source: Bloomberg, as of July 2, 2020

Fixed Income Index Month-to-Date Year-to-Date 12-Month
U.S. Broad Market 0.12% 6.26% 8.53%
U.S. Treasury –0.24% 8.60% 10.05%
U.S. Mortgages 0.04% 3.50% 5.45%
Municipal Bond 0.05% 2.08% 4.30%

Source: Morningstar Direct, as of July 2, 2020

What to Look Forward To

On Monday, the ISM Nonmanufacturing index for June was released. This measure of service sector confidence far surpassed economist estimates, increasing from 45.5 in May to 57.1 in June, against calls for a more modest rise to 50.2. This is another diffusion index, where values above 50 indicate expansion, so this swift rebound after the index hit a 10-year low of 41.8 in April is very encouraging. The service sector accounts for the lion’s share of economic activity, so the rapid recovery in confidence in June is a good sign for the ongoing economic recovery. As we saw with manufacturer confidence, reopening efforts in May and June served as a tailwind for service sector confidence during the month. Ultimately, this report indicates the pace of economic recovery was faster than initially expected once reopening efforts took hold.

On Thursday, we’ll get the initial jobless claims report for the week ending July 4. The level of initial jobless claims has improved for each of the past 13 weeks after hitting an all-time high of more than 6.8 million in the final week of March. Still, despite the continued improvement over three months, the level of weekly initial claims on an absolute basis remains elevated compared with historical norms. Throughout 2019, roughly 220,000 initial claims were made per week; June’s range of 1.4–1.6 million weekly claims is well above normal levels. These numbers indicate continuing pressure on the jobs market despite improvements we’ve seen since the end of March. We’ll continue to monitor this weekly report until the level of initial claim returns closer to normal.

On Friday, the Producer Price Index for June will be released. Economists expect to see producer prices increase by 0.4 percent for the month, following a 0.4 percent increase in May. Nonetheless, headline producer prices are likely to show a modest decline on a year-over-year basis. Core producer prices, which strip out the impact of volatile food and energy prices, are expected to increase by 0.1 percent in June after falling by 0.1 percent in May. Inflationary pressures have been kept at bay over the past few months due to the massive shock to demand created by the pandemic; however, with businesses reopening and producers and consumers starting to spend again, increased inflationary pressure is expected.

Disclosures: Certain sections of this commentary contain forward-looking statements that are based on our reasonable expectations, estimates, projections, and assumptions. Forward-looking statements are not guarantees of future performance and involve certain risks and uncertainties, which are difficult to predict. All indices are unmanaged and are not available for direct investment by the public. Past performance is not indicative of future results. The S&P 500 is based on the average performance of the 500 industrial stocks monitored by Standard & Poor’s. The Nasdaq Composite Index measures the performance of all issues listed in the Nasdaq Stock Market, except for rights, warrants, units, and convertible debentures. The Dow Jones Industrial Average is computed by summing the prices of the stocks of 30 large companies and then dividing that total by an adjusted value, one which has been adjusted over the years to account for the effects of stock splits on the prices of the 30 companies. Dividends are reinvested to reflect the actual performance of the underlying securities. The MSCI EAFE Index is a float-adjusted market capitalization index designed to measure developed market equity performance, excluding the U.S. and Canada. The MSCI Emerging Markets Index is a market capitalization-weighted index composed of companies representative of the market structure of 26 emerging market countries in Europe, Latin America, and the Pacific Basin. The Russell 2000® Index measures the performance of the 2,000 smallest companies in the Russell 3000® Index. The Bloomberg Barclays US Aggregate Bond Index is an unmanaged market value-weighted performance benchmark for investment-grade fixed-rate debt issues, including government, corporate, asset-backed, and mortgage-backed securities with maturities of at least one year. The U.S. Treasury Index is based on the auctions of U.S. Treasury bills, or on the U.S. Treasury’s daily yield curve. The Bloomberg Barclays US Mortgage Backed Securities (MBS) Index is an unmanaged market value-weighted index of 15- and 30-year fixed-rate securities backed by mortgage pools of the Government National Mortgage Association (GNMA), Federal National Mortgage Association (Fannie Mae), and the Federal Home Loan Mortgage Corporation (FHLMC), and balloon mortgages with fixed-rate coupons. The Bloomberg Barclays US Municipal Index includes investment-grade, tax-exempt, and fixed-rate bonds with long-term maturities (greater than 2 years) selected from issues larger than $50 million.


Mark Gallagher is a financial advisor located at Gallagher Financial Services at 2586 East 7th Ave. Suite #304, North Saint Paul, MN 55109. He offers securities and advisory services as an Investment Adviser Representative of Commonwealth Financial Network®, Member FINRA/SIPC, a Registered Investment Adviser. He can be reached at 651-774-8759 or at mark@markgallagher.com.

Authored by the Investment Research team at Commonwealth Financial Network.

© 2020 Commonwealth Financial Network ®


Market Update for the Quarter Ending June 30, 2020

Presented by Mark Gallagher

Positive June caps off strong quarter for markets
June was another positive month for markets, despite concerns about the spread of the coronavirus causing some volatility near month-end. All three major indices posted positive returns for the month. The S&P 500 returned 1.99 percent, the Dow Jones Industrial Average (DJIA) gained 1.82 percent, and the Nasdaq Composite rose by 6.07 percent. On a quarterly basis, all three indices showed strong rebounds following March’s volatility. The Nasdaq led the way with a quarterly gain of 30.95 percent, while the DJIA gained 18.51 percent and the S&P increased by 20.54 percent.

These strong results came despite worsening fundamentals. According to Bloomberg Intelligence, as of June 26, the estimated earnings growth rate for the S&P 500 in the second quarter is –44.1 percent. This is down from estimates at the start of the quarter for a more modest 16.1 percent decline. Over the long term, fundamentals drive performance. So, the market rally in the face of these numbers suggests that investors expect a continued recovery and are willing to overlook a quarter or two of declines. The expected poor second-quarter results, while concerning, are understandable, given the damage created by anti-pandemic measures that were in place for much of the quarter.

From a technical perspective, June was another mixed month for U.S. markets. The S&P 500 managed to break above its 200-day moving average at the end of May. It finished above trend for the second month in a row, despite briefly falling below this important technical level twice during the month. The DJIA broke above trend early in the month before falling back and finishing June below its 200-day moving average. The Nasdaq was the only major index that spent the entire month above its 200-day trend line, after doing the same in May.

The story was similar for international markets during the month and quarter. The MSCI EAFE Index gained 3.41 percent in June, capping off a quarter that saw the index rise by 14.88 percent. Emerging markets fared even better, gaining 7.40 percent in June and 18.18 percent for the quarter. The developed and emerging market indices remained below their 200-day moving averages at month-end. Both indices managed to briefly break above trend during the month, however, which is an encouraging sign.

Fixed income markets also had a solid month and quarter, driven by continued support from the Federal Reserve that kept interest rates constrained. The 10-year U.S. Treasury yield was largely range-bound. It started the period at 0.62 percent and hit a high of 0.91 percent in early June before falling back to 0.66 percent at quarter-end. The Bloomberg Barclays U.S. Aggregate Bond Index rose by 0.63 percent during the month and 2.90 percent for the quarter.

High-yield fixed income, which is typically driven less by interest rate movements and more closely correlated to equity markets, also had a strong quarter. The Bloomberg Barclays U.S. Corporate High Yield Index gained 0.98 percent in June and 10.18 percent for the quarter. High-yield bond spreads ended the month largely unchanged, after falling notably in both April and May.

Local outbreaks cause national case numbers to rise
Despite the positive news in the markets, the public health data released during the month showed some setbacks. New daily coronavirus cases in the U.S. set record highs toward month-end. Outbreaks in several states sparked fears of a national second wave of infections. Most of the attention was centered on rising case numbers in Arizona, California, Florida, and Texas, but cases have been increasing in other states as well. We finished the quarter with the highest level of active cases in the U.S. on record, although the daily case growth rate remained under control at the national level.

The rise in cases during the month led some state and local governments to pause or, in some instances, even roll back reopening efforts. For example, Florida and Texas recently announced they would be closing bars again, and large swaths of California are doing the same to try to contain localized outbreaks. These measures should help bring those outbreaks under control, even as they risk slowing the economic recovery.

Testing continued to improve in June, ending the month with a new daily high of roughly 650,000 tests, compared with roughly 400,000 at the end of May. Although the growth in testing capability is a positive development, current testing levels are still not high enough to track and contain the disease on a national level. This was evidenced by the increase in the ratio of positive tests we saw during the month. The seven-day moving average of positive tests increased from 4.9 percent at the start of June to 6.9 percent at month-end. The World Health Organization recommends that communities maintain a positive test rate of less than 5 percent for two weeks before reopening efforts begin.

The local outbreaks have raised risks and should be watched, but the daily case growth rate remains at a much better level than during the first wave and showed signs of stabilization at month-end. With states acting to contain the outbreaks, the risks at the national level remain low.

Data shows continued rebound in economic activity
The economic data released in June largely pointed to a faster-than-expected rebound in economic activity as reopening efforts took hold. Perhaps the best example of this comes from consumers, who saw confidence and spending figures rise notably. May’s retail sales report was a highlight, with headline sales rising by 17.7 percent against expectations for an 8.4 percent increase. Personal spending rose by 8.2 percent, indicating that consumers were ready and willing to go out and spend as reopening efforts kicked off. Consumer spending accounts for roughly two-thirds of overall economic activity, so these reports were very encouraging.

The strong consumer spending growth was supported by improving consumer confidence during the quarter. Both major measures of consumer sentiment rebounded in May and June after hitting multiyear lows in April. The Conference Board Consumer Confidence Survey was especially impressive. It improved from 85.9 in May to 98.1 in June, the largest single-month increase for the index since 2011. As you can see in Figure 1, there is still quite a way to go before we’re back to pre-pandemic confidence levels, but we’re heading in the right direction.

Figure 1. Conference Board Consumer Confidence, 2010–Present

Consumer confidence was supported by improving jobs numbers and a strong equity market rebound. May’s employment report showed a surprising 2.5 million jobs were created, against economist estimates for a loss of 7.5 million jobs. We’ve also seen initial jobless claims and continuing unemployment claims decline recently, indicating that the worst of the job losses caused by the pandemic is likely behind us. The improving employment situation in May was one of the first reports to show significantly better-than-expected results for the economy as reopening efforts began.

Business confidence and spending also showed improvement during the month. Business confidence, as measured by the monthly Institute for Supply Management Purchasing Managers’ Index surveys, rose in May after hitting multiyear lows in April. This improving confidence translated into faster spending growth. May’s durable goods orders report showed a 15.8 percent increase in orders, which helped offset an 18.1 percent decline in April. Core durable goods orders, which are often used as a proxy for business investment, also saw a solid rebound in May, indicating that businesses were willing to spend as reopening efforts took hold. All things considered, the improvements we saw on the economic front during the month were very encouraging and point to a faster-than-expected recovery if things stay on track.

Risks to economic recovery remain
Although the positive economic news we received in June was encouraging, most of the data was backward looking. It should be noted that risks to the economic recovery and market rally are still out there. Month-end headlines were focused primarily on the rising case count. Any further bad news about the pandemic could lead to slower reopening efforts or lowered confidence and spending figures. Given the market’s recent resilience, it does not seem like rising case counts on their own are likely to trigger more volatility. They could lead to worsening fundamentals, however, and should certainly be monitored.

Looking past the coronavirus, trade tensions between the U.S. and China continue to rise. This will be an important area to monitor as the recovery begins worldwide, given the damage to global trade caused by the pandemic. Rising social unrest here in the U.S. is also worth monitoring. The uncertainty created by continued demonstrations and calls for political action could lead to additional market volatility. And, as always, there is the possibility that currently unknown risks could surface and negatively affect markets.

Ultimately, though we saw positive economic updates during the month, the setbacks in containing the virus serve as a reminder that we are far from out of the woods. Even as overall conditions remain positive, over the next few months, we are likely to face challenges and volatility. Given this uncertainty, a well-diversified portfolio that matches timelines and risk levels remains the best path forward for most investors; however, you should consult with your financial advisor if concerns remain.

All information according to Bloomberg, unless stated otherwise.

Disclosure: Certain sections of this commentary contain forward-looking statements based on our reasonable expectations, estimates, projections, and assumptions. Forward-looking statements are not guarantees of future performance and involve certain risks and uncertainties, which are difficult to predict. Past performance is not indicative of future results. Diversification does not assure a profit or protect against loss in declining markets. All indices are unmanaged and investors cannot invest directly into an index. The Dow Jones Industrial Average is a price-weighted average of 30 actively traded blue-chip stocks. The S&P 500 Index is a broad-based measurement of changes in stock market conditions based on the average performance of 500 widely held common stocks. The Nasdaq Composite Index measures the performance of all issues listed in the Nasdaq Stock Market, except for rights, warrants, units, and convertible debentures. The MSCI EAFE Index is a float-adjusted market capitalization index designed to measure developed market equity performance, excluding the U.S. and Canada. The MSCI Emerging Markets Index is a market capitalization-weighted index composed of companies representative of the market structure of 26 emerging market countries in Europe, Latin America, and the Pacific Basin. It excludes closed markets and those shares in otherwise free markets that are not purchasable by foreigners. The Bloomberg Barclays Aggregate Bond Index is an unmanaged market value-weighted index representing securities that are SEC-registered, taxable, and dollar-denominated. It covers the U.S. investment-grade fixed-rate bond market, with index components for a combination of the Bloomberg Barclays government and corporate securities, mortgage-backed pass-through securities, and asset-backed securities. The Bloomberg Barclays U.S. Corporate High Yield Index covers the USD-denominated, non-investment-grade, fixed-rate, taxable corporate bond market. Securities are classified as high-yield if the middle rating of Moody’s, Fitch, and S&P is Ba1/BB+/BB+ or below.

Mark Gallagher is a financial advisor located at Gallagher Financial Services at 2586 East 7th Ave. Suite #304, North Saint Paul, MN 55109. He offers securities and advisory services as an Investment Adviser Representative of Commonwealth Financial Network®, Member FINRA/SIPC, a Registered Investment Adviser. He can be reached at 651-774-8759 or at mark@markgallagher.com.

Authored by the Investment Research team at Commonwealth Financial Network.

© 2020 Commonwealth Financial Network ®

Weekly Market Update, June 22, 2020

Presented by Mark Gallagher

General Market News
• Treasury rates were largely range bound last week, as Federal Reserve (Fed) Chairman Jerome Powell’s midweek testimony to Congress did not contain major market-moving news. The 10-year Treasury yield started the week at 0.70 percent, slightly higher than last week’s opening yield of 0.66 percent. The story was the same on the longer end of the curve, with the 30-year opening at 1.44 percent, compared with 1.40 percent the week before.
• Last week, global equities rebounded from the previous week’s pullback as indices posted gains across the board. The rebound, led by the Nasdaq, favored growth and momentum companies. The Fed’s choice to purchase individual corporate bonds and to kick off its Main Street Lending Program were among the reasons for the move higher. In addition, there is speculation that a future infrastructure stimulus plan could be proposed. Sectors that fared best during the week included health care, technology, consumer staples, and consumer discretionary. Underperforming sectors were bond proxy sectors in utilities, energy, and REITs.
• On Tuesday, May’s retail sales report was released. Sales blew away expectations, increasing by 17.7 percent against forecasts for an 8.4 percent increase. This rebound shows consumers were more than ready to get out and spend as states started reopening. Car sales were a highlight during the month, increasing by more than 40 percent from April; however, even core retail sales, which strip out the impact of auto and gas sales, rose by a better-than-expected 12.4 percent. All things considered, this was a positive report that indicates the economic recovery may be swifter than originally anticipated.
• Also released Tuesday was the National Association of Home Builders Housing Market Index for June. This measure of home builder confidence rose from 37 in May to 58 in June, against expectations for a more modest increase to 45. This was one of the largest single-month increases on record, as home builders cited significantly higher prospective home buyer interest during the month. Although there remains a long way to go to return to the recent high of 78, set in December, this better-than-expected report is a good sign for future home construction as we enter the summer months, with state economies largely opened up to renewed construction work.
• Speaking of new home construction, May’s building permits and housing starts reports were released Wednesday. Here, the news was a bit disappointing, as both measures of new home construction came in below expectations. Starts rose by 4.3 percent, against forecasts for a 23.5 percent increase. Permits rose by a more encouraging 14.4 percent, against calls for a 16.8 percent increase. Although the increased pace of new home construction in May was welcome, it followed April declines of more than 26 and 21 percent for starts and permits, respectively, so there remains a long way to go before returning to pre-pandemic activity levels.

Equity Index Week-to-Date Month-to-Date Year-to-Date 12-Month
S&P 500 1.88% 1.88% –3.19% 6.96%
Nasdaq Composite 3.74% 4.87% 11.39% 24.83%
DJIA 1.07% 2.05% –8.22% –0.88%
MSCI EAFE 2.05% 4.65% –10.27% –3.72%
MSCI Emerging Markets 1.53% 7.86% –9.36% –2.61%
Russell 2000 2.25% 1.85% –14.40% –7.90%

Source: Bloomberg, as of June 19, 2020

Fixed Income Index Month-to-Date Year-to-Date 12-Month
U.S. Broad Market 0.20% 5.92% 8.65%
U.S. Treasury –0.04% 8.31% 10.06%
U.S. Mortgages –0.25% 3.42% 5.56%
Municipal Bond 0.06% 1.88% 4.31%

Source: Morningstar Direct, as of June 19, 2020

What to Look Forward To
On Monday, May’s existing home sales report was released. Sales fell by 9.7 percent during the month, against expectations for a 5.6 percent decline. Following a 17.8 percent decline in April, this disappointing result brought the annualized pace of existing home sales down to a nine-year low of 3.91 million. The declines were geographically widespread, with sales down by double digits on a year-over-year basis across all four major regions of the country. Before the pandemic hit, existing home sales showed solid growth in 2019 and the first two months of 2020, peaking at an annualized rate of 5.76 million in February. With mortgage rates near a three-year low and consumer confidence stabilizing in June, we can hope home sales may rebound in the upcoming months. As May’s disappointing results showed, however, the disruption to the housing market caused by the pandemic was severe. It’s likely the pace of home sales will take some time to recover to pre-pandemic levels.

We’ll get another look at the housing market with Tuesday’s release of the May new home sales report. New home sales are expected to rise by 1.1 percent after posting a surprise 0.6 percent increase in April. New home sales are a smaller and, often, more volatile portion of the housing market compared with existing home sales, but the anticipated increase would still be a positive sign for the overall market. Once again, the combination of low rates and improving consumer demand is expected to serve as a tailwind for new home sales as we head into the summer. One key area to monitor will be the pace of new home construction, as the slowdown caused by the pandemic may serve as a temporary headwind to new home sales, especially in supply-constrained markets. Nonetheless, the better-than-expected home builder confidence figures should support faster new home construction, which, in turn, would likely boost new home sales.

On Thursday, the preliminary durable goods orders report for May will be released. Durable goods orders are expected to increase by 10.5 percent, following a 17.7 percent decline in April. Much of the anticipated increase can be attributed to transportation orders, which can be especially volatile on a month-to-month basis. Core durable goods orders, which strip out the impact of transportation orders, are set to increase by 2.5 percent during the month, following a 7.7 percent decline in April. Core durable goods orders are often seen as a proxy for business investment, so while this anticipated increase would be a positive development, it would indicate business spending will likely face a longer path back to pre-pandemic levels compared with consumer spending, which has already showed signs of a swifter rebound.

Thursday will also see the release of the weekly initial jobless claims estimate for the week ending June 20. Economists expect initial claims to fall for the 12th consecutive week, down to 1.3 million from just more than 1.5 million the previous week. Although continued declines for initial claims would be welcome, the pace of reduction has slowed over the past few weeks, indicating the job market still faces significant stress despite reopening efforts. We will continue to monitor these weekly releases until we see claims returning to historically normal levels.

On Friday, May’s personal income and personal spending reports will be released. Incomes are expected to fall by 6 percent, following a surprising 10.5 percent increase in April. Incomes were boosted by onetime CARES Act payments in April, which are not expected to have a meaningful effect in May. Spending is set to increase by 8.6 percent, partially offsetting a 13.6 percent decline in April that was the worst monthly decline for personal spending since records began being kept in 1959. Once again, though the anticipated increase in spending would be a welcome development, it will likely take some time to recover from the damage to consumer spending caused by the pandemic, even if the pace of recovery may be faster than originally anticipated.

Finally, we’ll finish the week with Friday’s release of the second and final estimate of the University of Michigan consumer sentiment index for June. Economists expect it to remain unchanged from the midmonth preliminary estimate of 78.9, up from 72.3 in May and higher than initial estimates of 75 in June. The much-better-than-expected May jobs report and equity market rebound likely contributed to this better-than-expected preliminary result. Improving consumer sentiment has historically supported faster consumer spending growth, so a continued rebound for this index would bode well for June’s spending figures. Although the anticipated increase would be welcome, confidence would still sit well below its recent high of 101 in February, so there remains much work to be done to fully restore consumer sentiment.

Disclosures: Certain sections of this commentary contain forward-looking statements that are based on our reasonable expectations, estimates, projections, and assumptions. Forward-looking statements are not guarantees of future performance and involve certain risks and uncertainties, which are difficult to predict. All indices are unmanaged and are not available for direct investment by the public. Past performance is not indicative of future results. The S&P 500 is based on the average performance of the 500 industrial stocks monitored by Standard & Poor’s. The Nasdaq Composite Index measures the performance of all issues listed in the Nasdaq Stock Market, except for rights, warrants, units, and convertible debentures. The Dow Jones Industrial Average is computed by summing the prices of the stocks of 30 large companies and then dividing that total by an adjusted value, one which has been adjusted over the years to account for the effects of stock splits on the prices of the 30 companies. Dividends are reinvested to reflect the actual performance of the underlying securities. The MSCI EAFE Index is a float-adjusted market capitalization index designed to measure developed market equity performance, excluding the U.S. and Canada. The MSCI Emerging Markets Index is a market capitalization-weighted index composed of companies representative of the market structure of 26 emerging market countries in Europe, Latin America, and the Pacific Basin. The Russell 2000® Index measures the performance of the 2,000 smallest companies in the Russell 3000® Index. The Bloomberg Barclays US Aggregate Bond Index is an unmanaged market value-weighted performance benchmark for investment-grade fixed-rate debt issues, including government, corporate, asset-backed, and mortgage-backed securities with maturities of at least one year. The U.S. Treasury Index is based on the auctions of U.S. Treasury bills, or on the U.S. Treasury’s daily yield curve. The Bloomberg Barclays US Mortgage Backed Securities (MBS) Index is an unmanaged market value-weighted index of 15- and 30-year fixed-rate securities backed by mortgage pools of the Government National Mortgage Association (GNMA), Federal National Mortgage Association (Fannie Mae), and the Federal Home Loan Mortgage Corporation (FHLMC), and balloon mortgages with fixed-rate coupons. The Bloomberg Barclays US Municipal Index includes investment-grade, tax-exempt, and fixed-rate bonds with long-term maturities (greater than 2 years) selected from issues larger than $50 million.

Mark Gallagher is a financial advisor located at Gallagher Financial Services at 2586 East 7th Ave. Suite #304, North Saint Paul, MN 55109. He offers securities and advisory services as an Investment Adviser Representative of Commonwealth Financial Network®, Member FINRA/SIPC, a Registered Investment Adviser. He can be reached at 651-774-8759 or at mark@markgallagher.com.

Authored by the Investment Research team at Commonwealth Financial Network.

© 2020 Commonwealth Financial Network ®

Weekly Market Update, June 15, 2020

Presented by Mark Gallagher

General Market News
• Rates took a bit of a roller coaster ride last week, as the 10-year Treasury yield spiked to as high as 0.93 percent following the previous week’s sell-off in the bond market. In fact, most of last week’s rates came back down just about as fast as they spiked the week before. The 10-year opened at 0.66 percent on Monday. The 30-year reached a high of 1.75 percent over the same time frame, falling to 1.40 percent as of Monday morning. The 2-year, which reached a recent high of 0.23 percent, opened at 0.18 percent.
• Global equities sold off last week, as a caution from the Federal Reserve (Fed) and concerns over another increase in coronavirus cases moved investors to the sidelines. Fed Chairman Jerome Powell said Fed officials expect to keep rates near zero through at least 2022. As has been the case throughout the year, the tech-oriented Nasdaq was least affected. Indices such as the Russell 2000, which provides exposure to smaller businesses, were hit harder. Last week, we witnessed a reversal of the value trend seen in the prior three weeks. During that time, stocks that had been beat up by the virus rallied; this was flipped last week, as value sectors, such as energy, financials, industrials, and materials, were all hit hard. Sectors that held up best included technology, communication services, and consumer discretionary.
• On Wednesday, May’s Consumer Price Index was released. Consumer prices fell modestly by 0.1 percent during the month, against expectations for no change. This brought the pace of year-over-year consumer inflation to a paltry 0.1 percent. Core consumer prices, which strip out the impact of volatile food and energy prices, also declined by 0.1 percent for the month, against expectations to remain flat. The April inflation reports showed the massive deflationary pressure caused by the coronavirus pandemic. Looking forward, this pressure is expected to remain until economic activity picks up notably.
• Also on Wednesday, the Federal Open Market Committee released its rate decision at its June meeting. As expected, the Fed kept the federal funds rate unchanged. The Fed also released economic forecasts that painted a bleak picture for the near future, with the economy expected to face considerable risks over the short and intermediate term. The Fed predicts a 6.5 percent decline in gross domestic product this year and a year-end unemployment rate of 9.3 percent. As a response to this discouraging outlook, the Fed remains committed to keeping rates low for the foreseeable future. Although the forecasts were dire, the Fed’s commitment to provide as much support as necessary shows that the central bank is ready and willing to pull out all the stops to help stimulate the economy.
• On Thursday, May’s Producer Price Index was released. Producer prices increased by 0.4 percent during the month, surpassing estimates for 0.1 percent growth. This brought the year-over-year pace of producer deflation up to –0.8 percent, from –1.2 percent in April. Core producer prices, which strip out energy and food prices, fell by 0.1 percent during the month, bringing the pace of year-over-year core producer inflation to 0.3 percent. This marks a four-year low for year-over-year core producer inflation. As was the case with consumer inflation estimates, economists aren’t anticipating a swift increase in producer inflation, given the headwinds created by the pandemic and the expected moderate pace of economic recovery.
• We finished the week with Friday’s release of the preliminary estimate of the University of Michigan consumer sentiment survey for June. This measure of consumer confidence beat expectations, rising from 72.3 in May to 78.9 in June, against forecasts for a more modest increase to 75. This was the largest single-month increase for the index since 2016, indicating consumers reacted positively to reopening efforts that began in May. The better-than-expected May jobs report, along with strong equity market performance over the past few months, likely contributed to this result. Although this was certainly a welcome development, the index still sits well below its pre-pandemic high of 101, set in February.


Equity Index Week-to-Date Month-to-Date Year-to-Date 12-Month
S&P 500 –4.73% –0.01% –4.98% 7.29%
Nasdaq Composite –2.27% 1.09% 7.38% 23.62%
DJIA –5.51% 0.96% –9.20% 0.53%
MSCI EAFE –4.21% 2.55% –12.07% –3.67%
MSCI Emerging Markets –1.53% 6.23% –10.73% –1.02%
Russell 2000 –7.89% –0.39% –16.28% –8.29%

Source: Bloomberg, as of June 12, 2020


Fixed Income Index Month-to-Date Year-to-Date 12-Month
U.S. Broad Market 0.72% 5.71% 9.21%
U.S. Treasury 1.30% 8.35% 10.72%
U.S. Mortgages 0.16% 3.68% 6.30%
Municipal Bond 0.56% 1.82% 4.49%

Source: Morningstar Direct, as of June 12, 2020

What to Look Forward To
On Tuesday, May’s retail sales report is set to be released. Headline sales are expected to increase by 7.9 percent during the month, following a 16.4 percent decline in April. Although an increase would certainly be welcome, it’s important to remember that the pandemic caused headline sales to drop by a combined 23.4 percent between February and April. One of the major drivers of this anticipated increase in headline sales is a rise in auto and gas sales, which rebounded in May as reopening efforts took hold. Core sales, which strip out the impact of volatile auto and gas prices, are set to increase by 4.5 percent in May, following a 16.2 percent decline in April. Again, while the anticipated increase in core sales would be welcome, it will likely be a long time before the overall pace of sales returns to pre-pandemic levels. Because consumer spending accounts for the lion’s share of economic activity, this release will continue to be widely monitored.

May’s industrial production report will also be released Tuesday. Production is expected to rise by 3 percent during the month, following an 11.2 percent decline in April. Factories were largely shut down in April and began gradually reopening in May, which explains the anticipated rebound. Manufacturing output is expected to top that gain, with economists forecasting a 5.9 percent increase to follow the 13.7 percent decline in April. Looking forward, both industrial production and manufacturing output are expected to face headwinds created by low energy prices, lowered global demand, and disrupted supply chains due to the pandemic. Compared with service-based sectors, a swift recovery to pre-pandemic levels may be more difficult for the industrial sector.

The third major release scheduled for Tuesday is the National Association of Home Builders Housing Market Index for June. This measure of home builder confidence is slated to increase from 37 in May to 44 in June. This would mark the second consecutive month of increased home builder confidence, following the index’s drop to a seven-year low of 30 in April. Despite the anticipated increase, the index would sit far below its recent high of 76, set in December 2019. Home builders cited a steep fall in foot traffic from potential buyers due to the pandemic as a major driver of this decline in confidence. But, with the country reopening, potential buyers may come back faster than expected. Such a rebound would likely lead to a faster-than-expected recovery for home builder confidence and spending.

On Wednesday, May’s building permits and housing starts reports are set to be released. Economists expect to see a strong rebound in both measures of new home construction, with permits and starts expected to increase by 14.9 percent and 23.5 percent, respectively. Nonetheless, these solid results would represent only a partial rebound from April, when anticoronavirus measures caused permits to fall by 20.8 percent and starts to plummet by 30.2 percent. As was the case with home builder confidence, the forecasted rebound for permits and starts in May would be a positive development for the housing market. Still, even if estimates hold, this segment has a long way to go before returning to recent highs.

We’ll finish the week with Thursday’s release of the weekly initial jobless claims report for the week ending June 13. Economists expect that 1.295 million initial unemployment claims will be filed during the week, down from 1.542 million the week before. Continuing claims are also expected to fall, from roughly 20.9 million to 19.4 million. If estimates hold, this report would mark the 11th consecutive week with declining initial claims. Although this anticipated decline is welcome, initial and continuing claims sit well above historical norms, indicating the jobs market remains under significant stress despite reopening efforts that began in May. We will continue to monitor these important weekly releases until we see claims return to more normal levels.

Disclosures: Certain sections of this commentary contain forward-looking statements that are based on our reasonable expectations, estimates, projections, and assumptions. Forward-looking statements are not guarantees of future performance and involve certain risks and uncertainties, which are difficult to predict. All indices are unmanaged and are not available for direct investment by the public. Past performance is not indicative of future results. The S&P 500 is based on the average performance of the 500 industrial stocks monitored by Standard & Poor’s. The Nasdaq Composite Index measures the performance of all issues listed in the Nasdaq Stock Market, except for rights, warrants, units, and convertible debentures. The Dow Jones Industrial Average is computed by summing the prices of the stocks of 30 large companies and then dividing that total by an adjusted value, one which has been adjusted over the years to account for the effects of stock splits on the prices of the 30 companies. Dividends are reinvested to reflect the actual performance of the underlying securities. The MSCI EAFE Index is a float-adjusted market capitalization index designed to measure developed market equity performance, excluding the U.S. and Canada. The MSCI Emerging Markets Index is a market capitalization-weighted index composed of companies representative of the market structure of 26 emerging market countries in Europe, Latin America, and the Pacific Basin. The Russell 2000® Index measures the performance of the 2,000 smallest companies in the Russell 3000® Index. The Bloomberg Barclays US Aggregate Bond Index is an unmanaged market value-weighted performance benchmark for investment-grade fixed-rate debt issues, including government, corporate, asset-backed, and mortgage-backed securities with maturities of at least one year. The U.S. Treasury Index is based on the auctions of U.S. Treasury bills, or on the U.S. Treasury’s daily yield curve. The Bloomberg Barclays US Mortgage Backed Securities (MBS) Index is an unmanaged market value-weighted index of 15- and 30-year fixed-rate securities backed by mortgage pools of the Government National Mortgage Association (GNMA), Federal National Mortgage Association (Fannie Mae), and the Federal Home Loan Mortgage Corporation (FHLMC), and balloon mortgages with fixed-rate coupons. The Bloomberg Barclays US Municipal Index includes investment-grade, tax-exempt, and fixed-rate bonds with long-term maturities (greater than 2 years) selected from issues larger than $50 million.

Mark Gallagher is a financial advisor located at Gallagher Financial Services at 2586 East 7th Ave. Suite #304, North Saint Paul, MN 55109. He offers securities and advisory services as an Investment Adviser Representative of Commonwealth Financial Network®, Member FINRA/SIPC, a Registered Investment Adviser. He can be reached at 651-774-8759 or at mark@markgallagher.com.

Authored by the Investment Research team at Commonwealth Financial Network.

© 2020 Commonwealth Financial Network ®