Presented by Mark Gallagher
Markets rebound in April
Equity markets saw a swift recovery in April, as progress toward slowing the spread of the coronavirus gave hope to investors. The S&P 500 rose by 12.82 percent, marking the best monthly gain since 1987. The Dow Jones Industrial Average (DJIA) gained 11.22 percent for the month, while the Nasdaq Composite, with its heavy technology weighting, led the way with a 15.49 percent gain.
These impressive results came despite worsening fundamentals. According to Bloomberg Intelligence, as of April 30, the blended average earnings growth rate for the S&P 500 for the first quarter sat at –16.4 percent. If the final earnings come in at this level, it would be the worst quarterly result since the second quarter of 2009. This is especially disappointing given the return to quarterly earnings growth that we saw in the fourth quarter. April’s market rally indicates investors may be willing to accept a few quarters of dismal earnings due to the coronavirus. This will be an important area to monitor as we begin to open up the economy, as fundamentals drive performance over the long term.
Technical factors for U.S. markets were mixed during the month. The S&P 500 and DJIA both spent April below their respective 200-day moving averages, although they moved closer to the trendline by month-end. The Nasdaq, however, was able to break through and finish April above its 200-day moving average. This is an important technical signal, as a prolonged break above trend could indicate a shift in investor sentiment. While it is too early to say that U.S. markets are out of the woods, the swift rebound in April was certainly a welcome development.
The story was much the same internationally, with foreign markets rebounding as well, although to a slightly lesser extent. The MSCI EAFE Index gained 6.46 percent during the month, bolstered by reopening efforts across select European countries. Emerging markets fared even better, gaining 9.18 percent. Despite these strong returns, both indices spent the month below their 200-day moving averages.
Fixed income, which benefited from continued low interest rates and supportive policy from the Federal Reserve (Fed), also had a strong month. The yield for the 10-year Treasury note was largely range bound, starting April at 0.62 percent and finishing the month at 0.64 percent. The Fed left rates unchanged at its April meeting after cutting the federal funds rate to zero in March. Fed Chair Jerome Powell used his press conference to reiterate that the Fed is willing and able to provide much-needed support during these uncertain times.
The Bloomberg Barclays U.S. Aggregate Bond Index gained 1.78 percent during the month. High-yield bonds fared even better, with the Bloomberg Barclays U.S. Corporate High Yield Index gaining 4.51 percent.
States begin reopening as coronavirus growth slows
In April, we saw real progress in the fight against the coronavirus, although there is still much work to be done. Case counts continue to increase, but the pace of growth for new cases has been falling. We ended the month with the daily case growth rate in the U.S. at its lowest level since the end of February. This shows the positive impact widespread social distancing and shelter-in-place orders have had on containing the virus. We’ve also seen some promising results for potential treatments, which have boosted confidence.
Given the progress we saw in April, some states have started the process of opening their economies back up. There is concern that this may lead to further localized spread of the coronavirus. But for the time being, these states will serve as an example for the rest of the country of what to expect upon reopening. Given the virus’s long incubation period and the resulting lag between policy changes and infection rates, it will take at least a couple of weeks to get a clear picture of exactly how reopening will affect new case counts.
Large-scale testing capabilities in the U.S. remain well below levels called for by experts in order to safely reopen large swaths of the economy. The impact of not having enough tests can be seen in the percentage of tests that come back positive, which still remains elevated despite generally following a downward trend during the month. Ultimately, testing will be the key tool to allow us to safely open up the economy until a vaccine is available.
Economic data highlights costs of lockdown
Although there was positive news on the coronavirus front, the story was very different for the economy as a whole. The economic data released in April was terrible, as expected. This highlights the devastating impact shelter-in-place orders have had on the economy. More than 30 million Americans filed initial jobless claims over the past 6 weeks, almost certainly sending the unemployment rate soaring above the 10 percent high it last hit in October 2009. Gross domestic product (GDP) contracted by an annualized rate of 4.8 percent in the first quarter, signaling that we are quite likely in a recession. Personal consumption, which was the major driver of economic growth last year, experienced its biggest decline since the fourth quarter of 2008, as you can see in Figure 1.
Figure 1. Personal Consumption Expenditures, 2007–Present
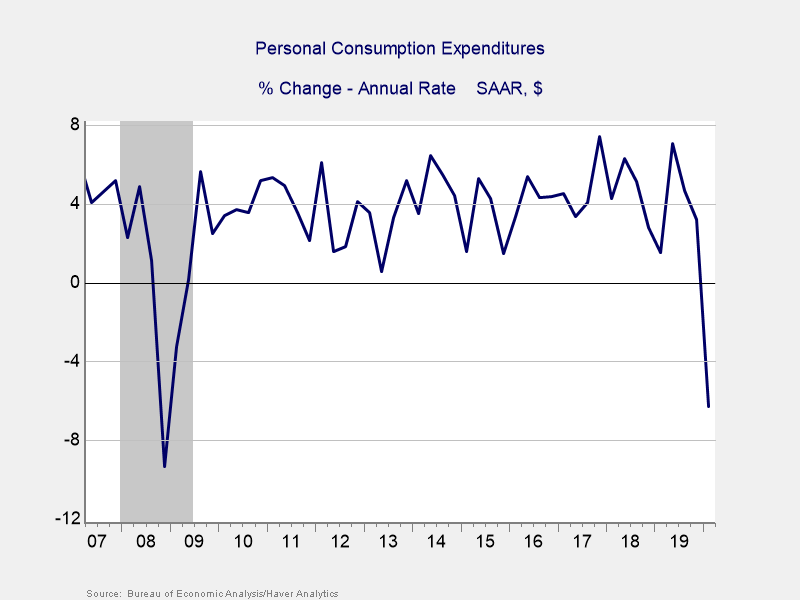
This sharp fall in consumer spending was greater than expected and highlights the risks April’s extended lockdowns pose to second-quarter growth. Consumer confidence plummeted during the month, with both the Conference Board and University of Michigan consumer sentiment indices now sitting at multiyear lows. A V-shaped recovery will largely rely on a swift rebound in consumer confidence and spending. So, this is an important area to monitor going forward.
Businesses also suffered during the month. Both manufacturers and the service sector saw declining confidence and output figures in April. Industrial production experienced its largest drop since 1946, with manufacturing output slashed as factories shut down in the latter half of March. Business confidence now sits at levels that have historically indicated a double-digit contraction in GDP is possible.
While the results released in April were terrible, even worse news is likely on its way. We will almost certainly see the unemployment rate rise past highs set during the 2008 financial crisis, and GDP is expected to contract much further in the second quarter. The good news is that much of the damage is now done. There is also a real possibility that growth may recover more quickly than currently expected once the virus is under control. But for the time being, the economic data is likely to get worse before it gets better.
Pandemic and economic risks remain, despite April market recovery
April was a surprisingly good month for markets, but it was the opposite for the economy as a whole—and for the average American. The rebound we saw in equities, combined with the cratering earnings outlook, indicates that markets are pricing in a faster recovery. So significant risk remains if the recovery is not as swift as markets expect.
As investors, we need to keep a long-term view on not just what we hope will happen, but on what is likely, too. Right now, markets are pricing in a bit of a best-case scenario. Earnings, for example, are expected to return to growth in the first quarter of next year. For that to be the case, we will likely need to have the coronavirus under much better control by then. This is certainly a possibility. But the reality is that we will likely face setbacks as we try to gradually reopen the economy, and the process might take longer than expected.
In this environment of uncertainty about both the virus and the economy, we can expect further volatility, even as we continue to make real progress. Given the likelihood of future market turbulence and the uncertain times we’re in, maintaining a well-diversified portfolio that matches investor goals and timelines remains the best path forward.
All information according to Bloomberg, unless stated otherwise.
Disclosure: Certain sections of this commentary contain forward-looking statements based on our reasonable expectations, estimates, projections, and assumptions. Forward-looking statements are not guarantees of future performance and involve certain risks and uncertainties, which are difficult to predict. Past performance is not indicative of future results. Diversification does not assure a profit or protect against loss in declining markets. All indices are unmanaged and investors cannot invest directly into an index. The Dow Jones Industrial Average is a price-weighted average of 30 actively traded blue-chip stocks. The S&P 500 Index is a broad-based measurement of changes in stock market conditions based on the average performance of 500 widely held common stocks. The Nasdaq Composite Index measures the performance of all issues listed in the Nasdaq Stock Market, except for rights, warrants, units, and convertible debentures. The MSCI EAFE Index is a float-adjusted market capitalization index designed to measure developed market equity performance, excluding the U.S. and Canada. The MSCI Emerging Markets Index is a market capitalization-weighted index composed of companies representative of the market structure of 26 emerging market countries in Europe, Latin America, and the Pacific Basin. It excludes closed markets and those shares in otherwise free markets that are not purchasable by foreigners. The Bloomberg Barclays Aggregate Bond Index is an unmanaged market value-weighted index representing securities that are SEC-registered, taxable, and dollar-denominated. It covers the U.S. investment-grade fixed-rate bond market, with index components for a combination of the Bloomberg Barclays government and corporate securities, mortgage-backed pass-through securities, and asset-backed securities. The Bloomberg Barclays U.S. Corporate High Yield Index covers the USD-denominated, non-investment-grade, fixed-rate, taxable corporate bond market. Securities are classified as high-yield if the middle rating of Moody’s, Fitch, and S&P is Ba1/BB+/BB+ or below.
Mark Gallagher is a financial advisor located at Gallagher Financial Services at 2586 East 7th Ave. Suite #304, North Saint Paul, MN 55109. He offers securities and advisory services as an Investment Adviser Representative of Commonwealth Financial Network®, Member FINRA/SIPC, a Registered Investment Adviser. He can be reached at 651-774-8759 or at mark@markgallagher.com.
Authored by the Investment Research team at Commonwealth Financial Network.
© 2020 Commonwealth Financial Network ®