Presented by Mark Gallagher
General Market News
• On Tuesday, the 10-year Treasury opened at 1.78 percent, lower than where it closed on Friday. The 30-year and 2-year yields also opened lower, at 2.24 percent and 1.54 percent, respectively. Treasury yields continued their downward trend, which has been ongoing since before the December holidays. With continued global economic slowing, uncertain geopolitical headlines, and intensifying domestic election coverage, yields could continue their downward trend in the short run.
• Global markets rallied last week. On Wednesday, the U.S. and China signed the “phase one” trade deal. The de-escalation of global trade tensions was one of the major themes cited for moving markets higher. On Thursday, the U.S. Senate approved the United States-Mexico-Canada Agreement. The attention now turns to trade negotiations between Europe and the U.S., as well as a potential “phase two” deal with China.
• Results were mixed for the start of earnings season. Morgan Stanley was up more than 10 percent, supported by its fixed income and commodities and clearing business. Wells Fargo, on the other hand, was down by more than 6 percent on higher-than-expected expenses. The top-performing sectors were utilities, technology, and materials, while the worst-performing sectors included energy, consumer discretionary, and financials. Consumer discretionary lagged as Target reported lower-than-expected holiday sales, citing softness in toys and electronics for the overall weakness.
• Last week’s economic releases kicked off on Tuesday with the December Consumer Price Index report. Consumer prices rose by 0.2 percent, against expectations for 0.3 percent growth. This result led to year-over-year consumer inflation of 2.3 percent, which was below expectations for 2.4 percent. Core inflation, which strips out the impact of volatile food and energy prices, also came in below expectations with 0.1 percent growth, compared with the 0.2 percent that was forecasted.
• On Wednesday, December’s Producer Price Index was released. Price gains were muted for producers as well, with headline producer inflation increasing by 0.1 percent during the month against expectations for 0.2 percent growth. On a year-over-year basis, producer inflation grew by 1.3 percent, which was in line with expectations. The moderate increases in both consumer and producer inflation during the month leave inflation well within the Federal Reserve’s (Fed’s) stated 2 percent target range. The lack of inflationary pressure following a year with three interest rate cuts indicates that the Fed will likely view the past year’s cuts as appropriate. It’s unlikely the Fed will make any material changes to monetary policy, unless there is a major change to the current outlook.
• On Thursday, December’s retail sales report was released. Sales grew by 0.3 percent during the month, in line with expectations. This matches the revised 0.3 percent gain we saw in November and brought year-over-year growth up to 5.8 percent, the highest since August 2018. The gains were widespread, with all major categories seeing growth except for auto, which can be volatile on a month-to-month basis. Sales excluding autos grew by 0.7 percent, which is the best result for core sales in five months. Ending the year with retail sales growth is a positive for both fourth-quarter and future gross domestic product growth, as consumer spending has been the major driver of the economic expansion over the past year.
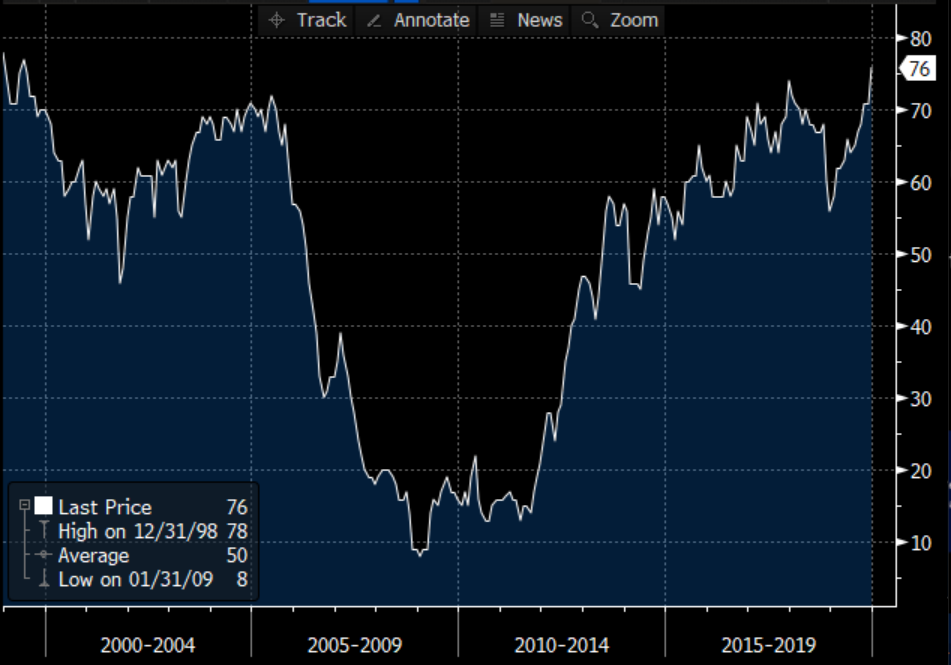
• Thursday also saw the release of the National Association of Home Builders Housing Market Index. This gauge of home builder confidence came in better than expected, falling from 76 in December to 75 in January, against expectations for a more severe drop to 74. November’s result was a 20-year high for the index, so this slight drop is nothing to worry about. In fact, this marks the highest back-to-back reading for the index since 1999. Low mortgage rates, high consumer confidence, and strong personal balance sheets continue to drive prospective buyers into the market, as the subindex that tracks prospective buyer traffic rose to the highest level since 1998. Home builders have certainly noticed this pickup in demand and have scrambled to ramp up construction accordingly.
• Speaking of new construction, Friday saw the release of December’s building permits and housing starts reports, which blew away expectations. Permits declined by slightly more than expected during the month, but the real story was housing starts, which increased by 16.9 percent against expectations for 1.1 percent. This brought the pace of new home sales to the highest level since December 2006, as home builders showed they are more than willing to meet rising buyer demand with new construction. On a year-over-year basis, housing starts grew by more than 40 percent in December, marking a six-year high. The strong rebound in the housing market was one of the major bright spots for the economy, so these better-than-expected results for home builder confidence and housing starts are a great sign for 2020.
• Finally, we finished the week with Friday’s release of the University of Michigan consumer sentiment index for January. Consumer sentiment declined slightly, from 99.3 in December to 99.1 in January, against expectations to remain steady at 99.3. Despite the slight decline to start the year, consumer sentiment still remains well above the recent three-year low of 89.8 we saw last August. The resiliency of the index is impressive, given the uncertainty caused by the escalating tensions between the U.S. and Iran. Ultimately, while the decline in sentiment is disappointing, given the events over the past few weeks and the recovery we saw in the fourth quarter, there is nothing to worry about for the time being.
| Equity Index | Week-to-Date | Month-to-Date | Year-to-Date | 12-Month |
| S&P 500 | 1.99% | 3.14% | 3.14% | 27.18% |
| Nasdaq Composite | 2.29% | 4.67% | 4.67% | 32.61% |
| DJIA | 1.84% | 2.92% | 2.92% | 21.67% |
| MSCI EAFE | 0.85% | 1.04% | 1.04% | 17.40% |
| MSCI Emerging Markets | 1.17% | 2.91% | 2.91% | 15.59% |
| Russell 2000 | 2.54% | 1.90% | 1.90% | 16.31% |
Source: Bloomberg
| Fixed Income Index | Month-to-Date | Year-to-Date | 12-Month |
| U.S. Broad Market | 0.50% | 0.50% | 9.28% |
| U.S. Treasury | 0.47% | 0.47% | 7.82% |
| U.S. Mortgages | 0.32% | 0.32% | 6.73% |
| Municipal Bond | 1.04% | 1.04% | 8.25% |
Source: Morningstar Direct
What to Look Forward To
Wednesday will see the release of December’s existing home sales report. Sales are expected to increase by 1.5 percent during the month. November’s report showed a 1.7 percent decline, which was primarily attributed to lack of supply, as housing stock remains very low on average. If the estimates prove accurate, December would mark the sixth straight month with year-over-year growth in existing home sales. This upward trend follows a prolonged slowdown throughout 2018 and the early part of 2019. As we saw with the home builder figures released last week, housing has been on a hot streak. A return to monthly growth for existing home sales would help further solidify the strength of this important area of the economy.
Disclosures: Certain sections of this commentary contain forward-looking statements that are based on our reasonable expectations, estimates, projections, and assumptions. Forward-looking statements are not guarantees of future performance and involve certain risks and uncertainties, which are difficult to predict. All indices are unmanaged and are not available for direct investment by the public. Past performance is not indicative of future results. The S&P 500 is based on the average performance of the 500 industrial stocks monitored by Standard & Poor’s. The Nasdaq Composite Index measures the performance of all issues listed in the Nasdaq Stock Market, except for rights, warrants, units, and convertible debentures. The Dow Jones Industrial Average is computed by summing the prices of the stocks of 30 large companies and then dividing that total by an adjusted value, one which has been adjusted over the years to account for the effects of stock splits on the prices of the 30 companies. Dividends are reinvested to reflect the actual performance of the underlying securities. The MSCI EAFE Index is a float-adjusted market capitalization index designed to measure developed market equity performance, excluding the U.S. and Canada. The MSCI Emerging Markets Index is a market capitalization-weighted index composed of companies representative of the market structure of 26 emerging market countries in Europe, Latin America, and the Pacific Basin. The Russell 2000® Index measures the performance of the 2,000 smallest companies in the Russell 3000® Index. The Bloomberg Barclays US Aggregate Bond Index is an unmanaged market value-weighted performance benchmark for investment-grade fixed-rate debt issues, including government, corporate, asset-backed, and mortgage-backed securities with maturities of at least one year. The U.S. Treasury Index is based on the auctions of U.S. Treasury bills, or on the U.S. Treasury’s daily yield curve. The Bloomberg Barclays US Mortgage Backed Securities (MBS) Index is an unmanaged market value-weighted index of 15- and 30-year fixed-rate securities backed by mortgage pools of the Government National Mortgage Association (GNMA), Federal National Mortgage Association (Fannie Mae), and the Federal Home Loan Mortgage Corporation (FHLMC), and balloon mortgages with fixed-rate coupons. The Bloomberg Barclays US Municipal Index includes investment-grade, tax-exempt, and fixed-rate bonds with long-term maturities (greater than 2 years) selected from issues larger than $50 million.
Mark Gallagher is a financial advisor located at Gallagher Financial Services at 2586 East 7th Ave. Suite #304, North Saint Paul, MN 55109. He offers securities and advisory services as an Investment Adviser Representative of Commonwealth Financial Network®, Member FINRA/SIPC, a Registered Investment Adviser. He can be reached at 651-774-8759 or at mark@markgallagher.com.
Authored by the Investment Research team at Commonwealth Financial Network.
© 2020 Commonwealth Financial Network ®