Presented by Mark Gallagher
General Market News
• After the Federal Open Market Committee (FOMC) meeting on June 19, rates have ranged between 1.97 percent and 2.06 percent. The 10-year Treasury yield opened at 2.01 percent on Monday. Most of the curve moved slightly lower, with the 1-month and 3-month yields moving the most. Bond investors are anticipating a possible rate cut at the end of July FOMC meeting.
• All three major U.S. markets were down slightly ahead of the meeting between President Trump and Chinese leader Xi Jinping. Despite the tension surrounding the G20 meeting, the market actually moved away from bond proxies and favored a more risk-on sentiment. As the week continued, the consensus expectation was that there would be a truce that would restart trade negotiations. As a result, REITs and utilities sold off, and investors rotated into financials, materials, and industrials. Financials were supported by the U.S. banks passing their capital asset stress tests. The pass allowed many of these firms, such as JPMorgan, Bank of America, and Wells Fargo, to propose raising dividends.
• Turning to economic reports, we saw the release of May’s new home sales report last Tuesday. Sales fell by 7.8 percent during the month, which was a disappointment given economist expectations for growth of 2.2 percent. This marks the second straight month of declining new home sales.
• Also on Tuesday, the Conference Board Consumer Confidence Index was released, dropping sharply from 131.3 in May down to 121.5 in June. Both the present condition and future expectations indices declined during the month, as concerns regarding trade tensions with China outweighed the positive tailwind from the month’s strong equity performance.
• On Wednesday, we received the first estimate of May’s durable goods orders. Headline orders declined by 1.3 percent, in large part due to the ongoing issues Boeing is having with its grounded 737 MAX airplanes. The core durable goods figure, however, which strips out transportation orders, grew 0.3 percent in May. This steady growth in the core figure suggests that overall business investment remains healthy, despite the problems with Boeing.
• On Friday, May’s personal income and personal spending reports were released. Income grew by 0.5 percent in May, while spending rose by 0.4 percent. These results were largely in line with expectations and show growth remained constant with April’s levels.
• Finally, the week ended with the release of the second and final estimate of the University of Michigan consumer sentiment index for June. Consumer confidence increased from 97.9 mid-month to 98.2 by month-end. This improvement was driven by a jump in the current conditions index, which was likely helped by the strong equity returns we saw during the month. While this improvement is encouraging, the index still sits slightly below May’s level.
| Equity Index | Week-to-Date | Month-to-Date | Year-to-Date | 12-Month |
| S&P 500 | –0.27% | 7.05% | 18.54% | 10.51% |
| Nasdaq Composite | –0.30% | 7.51% | 21.33% | 7.88% |
| DJIA | –0.45% | 7.31% | 15.40% | 12.45% |
| MSCI EAFE | 0.67% | 5.93% | 14.49% | 2.64% |
| MSCI Emerging Markets | 0.43% | 6.24% | 10.76% | 3.83% |
| Russell 2000 | 1.16% | 7.07% | 16.98% | –3.41% |
Source: Bloomberg
| Fixed Income Index | Month-to-Date | Year-to-Date | 12-Month |
| U.S. Broad Market | 1.26% | 6.11% | 7.91% |
| U.S. Treasury | 0.92% | 5.18% | 7.23% |
| U.S. Mortgages | 0.72% | 4.17% | 6.31% |
| Municipal Bond | 0.37% | 5.09% | 6.74% |
Source: Morningstar Direct
What to Look Forward To
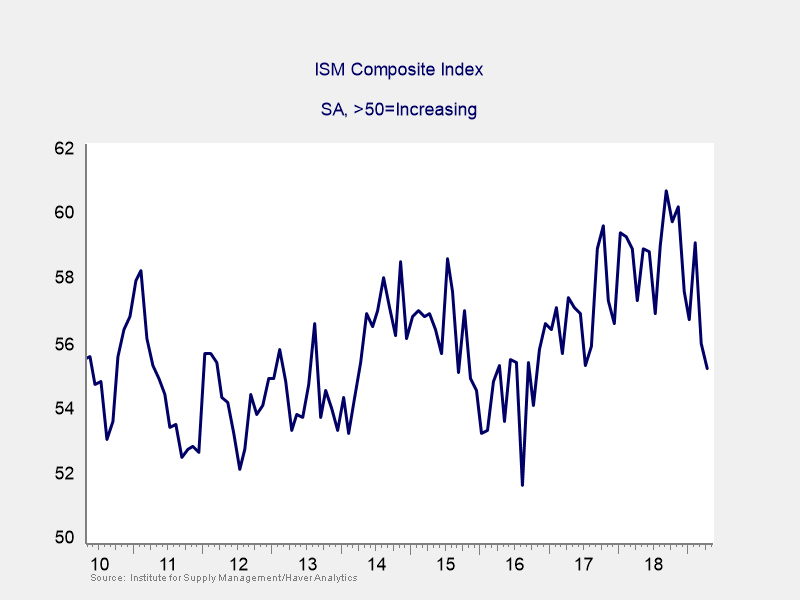
On Monday, data from the Institute for Supply Management (ISM) Manufacturing index was released. This measure of manufacturer optimism fell from 52.1 in May to 51.7 in June. This decline was smaller than economists expected, but it still brought the index to its lowest level since October 2016. This is a diffusion index, where values greater than 50 indicate expansion, so manufacturers still expect growth going forward.
On Wednesday, we will receive the report on May’s international trade balance. It is expected to show the deficit widening from $50.8 billion to $52.5 billion during the month. Declines in both imports and exports are expected, given the increasing pressure on global trade from the ongoing trade war between China and the U.S.
Wednesday will also see the release of the ISM Nonmanufacturing index. It is expected to drop from 56.9 to 56 in June, following a jump in May that was larger than economists expected. Despite the expected modest pullback, the index still shows solid growth expectations for the service sector.
Finally, on Friday, we will receive June’s employment report. It is slated to show 160,000 new jobs were added during the month. The unemployment rate is expected to stay at 3.6 percent, which represents the lowest level since August 1969.
Disclosures: Certain sections of this commentary contain forward-looking statements that are based on our reasonable expectations, estimates, projections, and assumptions. Forward-looking statements are not guarantees of future performance and involve certain risks and uncertainties, which are difficult to predict. All indices are unmanaged and are not available for direct investment by the public. Past performance is not indicative of future results. The S&P 500 is based on the average performance of the 500 industrial stocks monitored by Standard & Poor’s. The Nasdaq Composite Index measures the performance of all issues listed in the Nasdaq Stock Market, except for rights, warrants, units, and convertible debentures. The Dow Jones Industrial Average is computed by summing the prices of the stocks of 30 large companies and then dividing that total by an adjusted value, one which has been adjusted over the years to account for the effects of stock splits on the prices of the 30 companies. Dividends are reinvested to reflect the actual performance of the underlying securities. The MSCI EAFE Index is a float-adjusted market capitalization index designed to measure developed market equity performance, excluding the U.S. and Canada. The MSCI Emerging Markets Index is a market capitalization-weighted index composed of companies representative of the market structure of 26 emerging market countries in Europe, Latin America, and the Pacific Basin. The Russell 2000® Index measures the performance of the 2,000 smallest companies in the Russell 3000® Index. The Bloomberg Barclays US Aggregate Bond Index is an unmanaged market value-weighted performance benchmark for investment-grade fixed-rate debt issues, including government, corporate, asset-backed, and mortgage-backed securities with maturities of at least one year. The U.S. Treasury Index is based on the auctions of U.S. Treasury bills, or on the U.S. Treasury’s daily yield curve. The Bloomberg Barclays US Mortgage Backed Securities (MBS) Index is an unmanaged market value-weighted index of 15- and 30-year fixed-rate securities backed by mortgage pools of the Government National Mortgage Association (GNMA), Federal National Mortgage Association (Fannie Mae), and the Federal Home Loan Mortgage Corporation (FHLMC), and balloon mortgages with fixed-rate coupons. The Bloomberg Barclays US Municipal Index includes investment-grade, tax-exempt, and fixed-rate bonds with long-term maturities (greater than 2 years) selected from issues larger than $50 million.
Mark Gallagher is a financial advisor located at Gallagher Financial Services at 2586 East 7th Ave. Suite #304, North Saint Paul, MN 55109. He offers securities and advisory services as an Investment Adviser Representative of Commonwealth Financial Network®, Member FINRA/SIPC, a Registered Investment Adviser. He can be reached at 651-774-8759 or at mark@markgallagher.com.
Authored by the Investment Research team at Commonwealth Financial Network.
© 2019 Commonwealth Financial Network ®