Presented by Mark Gallagher
Another strong month for markets
February was a short but sweet month for investors. U.S. equity markets followed up their strong performance in January with another solid month of positive returns. The Dow Jones Industrial Average led the way with a monthly return of 4.03 percent. The S&P 500 and Nasdaq Composite were close behind with returns of 3.21 percent and 3.60 percent, respectively. All three indices have already returned double digits to start the year.
Improving fundamentals supported this positive performance. According to FactSet, the blended earnings growth rate for the S&P 500 stands at 13.1 percent (as of February 22, 2019). This result is up from estimates of 12.1 percent at the end of December. Further, this improvement was widespread, with 7 of 11 sectors reporting better earnings than at year-end. Technicals were also supportive, with all three indices ending the month above their 200-day moving averages.
The international story was much the same. The MSCI EAFE Index gained 2.55 percent in February. The MSCI Emerging Markets Index came in a bit lower, with a return of 0.23 percent. Developed markets were supported by news of a potential Brexit delay, but a global slowdown in trade continued to weigh on emerging markets.
Technicals continued to be a challenge for developed international markets. The MSCI EAFE Index remained below its 200-day moving average for the ninth month in a row, although it came close to hitting its trend line by month-end. Technically speaking, emerging markets had a better month. They broke above their trend line at the beginning of the month and ended February in positive territory.
Fixed income had a slightly more difficult month. The Bloomberg Barclays U.S. Aggregate Bond Index fell by 0.06 percent. This decline was due to a slight increase in rates in February. The 10-year U.S. Treasury opened the month at 2.70 percent and ended it at 2.73 percent. High-yield fared better, with a solid return of 1.66 percent in February. High-yield spreads have come down steadily to start the year following a spike in December.
Risks diminished as economic news trickled in
Another driver of the strong market performance was the widespread reduction in major risks to markets. Here in the U.S., we avoided a second government shutdown in as many months by passing a bipartisan funding bill by the February 15 deadline. We also saw progress on trade negotiations with China, with the U.S. putting a stop to scheduled tariff increases while negotiations continued. Any positive news here would be a boon for markets.
Looking abroad, political developments were also positive. Namely, an announcement by British Prime Minister Theresa May buoyed European markets. In it, she said the British Parliament may vote to delay Brexit if a deal is not reached by the March 29 deadline. This delay could avoid the dreaded no-deal Brexit scenario, which would likely throw the U.K. economy into chaos as trade deals and everyday routines would get disrupted overnight. Risks do remain here, and the negotiations should be monitored. But, overall, concerns appear to have diminished for the time being.
Economic picture messy and incomplete
The government shutdown in December and January delayed most of the major economic data releases scheduled for that time. In fact, we are still receiving this delayed data sporadically. But much of the data we do have has painted a picture of an economy that took a stumble in December before rebounding to start the year.
This drop and subsequent rebound can be seen through the lens of consumer confidence. Figure 1 shows the Conference Board’s monthly survey of consumer confidence. It declined sharply in December and January before showing a solid rebound in February. This rebound was driven by the end of the government shutdown and the strong market performance to start the year. But a surge of 304,000 new jobs in January also played a part.
Figure 1. Conference Board Consumer Confidence Survey, 2014–Present
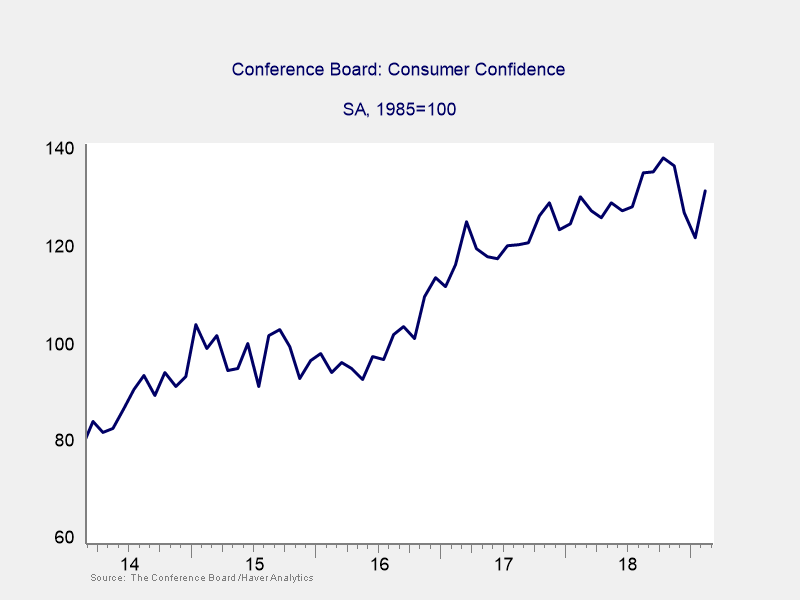
Increased confidence measures tend to lead to higher spending levels, so this rebound is encouraging. Much like confidence, consumer spending declined significantly in December. Here, retail sales were especially disappointing. In fact, December’s decline was the largest one-month drop since September 2009. On a more positive note, the personal savings rate in December was the highest it has been in nearly three years. As such, consumers still have money to spend. With the recent rise in confidence, hopefully we will see consumers more willing to spend some of these extra savings.
Disappointing consumer spending in December played a part in a lowered growth rate for the economy in the fourth quarter. The first estimate of fourth-quarter gross domestic product growth came in at 2.6 percent on an annualized basis. This figure is down from the 3.4-percent growth rate seen in the third quarter, although it still represents a solid end to the year. But if consumer spending can pick up steam and businesses can remain confident, we could see an increase in overall economic growth.
Keep an eye on the risks
Most of the major risks we have been worrying about over the past few months appear to be diminishing. Still, there are some important areas to watch. The housing market remains a major domestic concern and is in a period of contraction. Existing home sales have fallen on a year-over-year basis for each of the past 11 months. Plus, homebuilder confidence increased slightly in February but is still well below levels seen a year ago. Housing is a major sector of the U.S. economy and provides many knock-on effects for other industries. As such, this slowdown is concerning.
International risks also remain. Brexit negotiations in Europe and trade talks with China have garnered much of the attention. Recently, there have been positive developments in both of these areas. But these types of negotiations can be quite volatile. So, there is no guarantee that these potential areas for concern will not affect markets.
New risks could also spring up at any time. For example, the hostilities between India and Pakistan recently flared up over military conflict in the Kashmir region. This has been an ongoing conflict between the two countries since their separation. But any escalation between two nuclear powers is concerning. There have been positive developments here, including Pakistan’s offer to return a captured Indian pilot. Nonetheless, this is an important conflict to watch.
U.S. economy and outlook remain robust
Despite the risks and the slowdown at the end of 2018, the outlook for the economy and markets remains healthy. Corporations continue to post healthy earnings growth. Plus, markets appear to have weathered December’s volatility with two strong rebound months. Going forward, maintaining high confidence levels for both businesses and consumers remains important. We will need additional spending to grow the economy at a similar pace to last year.
Overall, things look pretty good for U.S. investors. Of course, some risks remain. But the markets’ rebound from the recent volatility showcases the importance of building a portfolio that can ride out short-term turbulence. As always, it is important to keep in mind that a well-diversified portfolio that matches your risk tolerance to your financial goals remains the best way to meet those goals going forward.
All information according to Bloomberg, unless stated otherwise.
Disclosure: Certain sections of this commentary contain forward-looking statements based on our reasonable expectations, estimates, projections, and assumptions. Forward-looking statements are not guarantees of future performance and involve certain risks and uncertainties, which are difficult to predict. Past performance is not indicative of future results. Diversification does not assure a profit or protect against loss in declining markets. All indices are unmanaged and investors cannot invest directly into an index. The Dow Jones Industrial Average is a price-weighted average of 30 actively traded blue-chip stocks. The S&P 500 Index is a broad-based measurement of changes in stock market conditions based on the average performance of 500 widely held common stocks. The Nasdaq Composite Index measures the performance of all issues listed in the Nasdaq Stock Market, except for rights, warrants, units, and convertible debentures. The MSCI EAFE Index is a float-adjusted market capitalization index designed to measure developed market equity performance, excluding the U.S. and Canada. The MSCI Emerging Markets Index is a market capitalization-weighted index composed of companies representative of the market structure of 26 emerging market countries in Europe, Latin America, and the Pacific Basin. It excludes closed markets and those shares in otherwise free markets that are not purchasable by foreigners. The Bloomberg Barclays Aggregate Bond Index is an unmanaged market value-weighted index representing securities that are SEC-registered, taxable, and dollar-denominated. It covers the U.S. investment-grade fixed-rate bond market, with index components for a combination of the Bloomberg Barclays government and corporate securities, mortgage-backed pass-through securities, and asset-backed securities. The Bloomberg Barclays U.S. Corporate High Yield Index covers the USD-denominated, non-investment-grade, fixed-rate, taxable corporate bond market. Securities are classified as high-yield if the middle rating of Moody’s, Fitch, and S&P is Ba1/BB+/BB+ or below.
Mark Gallagher is a financial advisor located at Gallagher Financial Services at 2586 East 7th Ave. Suite #304, North Saint Paul, MN 55109. He offers securities and advisory services as an Investment Adviser Representative of Commonwealth Financial Network®, Member FINRA/SIPC, a Registered Investment Adviser. He can be reached at 651-774-8759 or at mark@markgallagher.com.
Authored by Brad McMillan, CFA®, CAIA, MAI, managing principal, chief investment officer, and Sam Millette, fixed income analyst, at Commonwealth Financial Network®.
© 2019 Commonwealth Financial Network®