Presented by Mark Gallagher
New year kicks off with stock market rebound
Markets around the world had a great start to the year, with almost everything going up. Here in the U.S., the Nasdaq Composite led the pack with a return of 9.79 percent. The S&P 500 and Dow Jones Industrial Average (DJIA) were close behind with returns of 8.01 percent and 7.29 percent, respectively. These gains helped offset the losses in December and led to the best January in years.
One of the drivers of this market rebound was continued earnings growth. According to FactSet, with 22 percent of companies reporting, the blended average earnings growth rate for the S&P 500 for the fourth quarter is 10.9 percent (as of January 25, 2019). This figure would represent the fifth straight quarter of double-digit earnings growth. It would also be well above analyst forecasts. Still, it may be the last quarter of double-digit growth for a while. Analysts are currently forecasting low single-digit growth for the next three quarters.
From a technical perspective, all three major U.S. indices moved closer to their 200-day moving averages in January. The DJIA finished the month above its trend line, while the S&P 500 and Nasdaq finished near their respective moving averages. U.S. markets have been below these important technical levels since early in the fourth quarter of 2018. As such, a sustained break above them would be a positive development, indicating that investors’ views on the U.S. have become more positive.
The international story was much the same. The MSCI EAFE Index gained 6.57 percent in January. The MSCI Emerging Markets Index fared even better, with a gain of 8.78 percent. In fact, this gain was enough to bring the index above its 200-day moving average at month-end for the first time since May 2018. The developed market index remained below its trend line.
Even fixed income had a positive month, with a gain of 1.06 percent for the Bloomberg Barclays U.S. Aggregate Bond Index. High-yield did even better, with a gain of 4.52 percent for the Bloomberg Barclays U.S. Corporate High Yield Index. The Federal Reserve (Fed) did not increase the federal funds rate at its January meeting, and much of the released commentary was supportive of future economic growth. The potential for future rate hikes has subsided recently, which has also helped fixed income performance.
Despite uncertainty, economic growth continues
At the end of 2018, a wide range of negative news cast a shadow of uncertainty over the economy. But January was much more positive. First, the end of the longest government shutdown in U.S. history near month’s end helped considerably. Second, reported progress on China trade talks was also constructive. Of course, the potential for further uncertainty remains, especially with another possible shutdown beginning on February 15. But the temporary return to normal is certainly welcome.
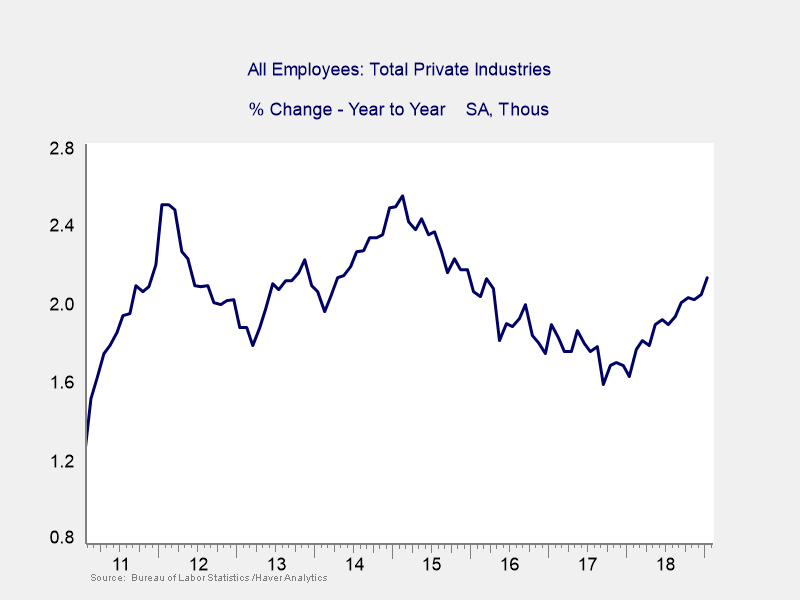
Despite worries over the shutdown, trade, and Brexit, the fundamental economic data was positive. An impressive 304,000 new jobs were added during the month. This figure was well above expectations for a more modest 165,000. Unemployment rose to 4 percent—although this increase was largely due to the effects of the shutdown and should reverse next month. As you can see in Figure 1, the growth in jobs on a year-over-year basis steadily improved in 2018 following declines since 2015. It continues to do so to start off 2019.
Figure 1. Year-Over-Year Growth in Private Workers, 2010–2019
Other highlights from the month included better-than-expected manufacturing and industrial production in December. These gains were largely due to increased vehicle production. Manufacturing was especially impressive. Here, we saw 1.1-percent monthly growth against expectations for a more modest 0.3 percent. In the face of slowing global growth, a strong dollar, and trade concerns, these healthy figures show that U.S. manufacturing continues to move forward.
Another positive development was weaker-than-expected consumer and producer inflation. Both measures remain near the Fed’s targeted 2-percent inflation goal, so further rate hikes are possible. But the slowing growth in inflation means that the Fed may be more gradual if and when it decides to hike again.
Much of December’s and January’s data was delayed by the government shutdown. This included the first estimate of fourth-quarter gross domestic product growth. As such, we don’t have a complete picture of how the economy weathered the shutdown. That said, the data we did see was mostly positive. Given that, once we get the full story, we’ll likely see a healthy economy expanding at a solid pace.
Risks remain, especially in the short run
Although the economy is in solid shape, there are risks in the short term that bear watching. The most pressing is the potential for another government shutdown in mid-February. The same immigration debate that drove the last shutdown will take center stage. Once again, investors should be ready to withstand any potential volatility.
Consumer and business confidence levels would be most at risk from another shutdown. These levels dropped in January during the last shutdown but rebounded slightly once it ended. Another shutdown might well lead to further declines in confidence. It’s important to note that a short-term drop in confidence is not something to worry about. But sustained weakness here could lead to lower spending levels in the long run.
Another area of concern is housing, which remains weak despite lower mortgage rates. In December, pending home sales fell by 9.8 percent. This capped a year in which pending home sales declined on a year-over-year basis every month. Housing is an important sector of the economy with various knock-on effects, so this weakness should be monitored.
International risks also remain. Here, contentious Brexit negotiations and a slowdown in Chinese growth grabbed most of the headlines. Much like housing, these are longer-term issues that should be monitored. But they are not necessarily immediate sources of volatility for U.S. markets.
Solid start for 2019
Things went better than expected to start the year. Strong market performance in January and solid economic data show that the U.S. continues to be a healthy environment for investors. Of course, there is the potential for more volatility in the short term. But over the long term, a strong economy continues to be supportive of markets.
Many of the risks we faced at year-end moderated in January. This has left us in a stronger position than when the month started. Risks do remain, but the outlook is better than we could have expected only a month ago. As always, it is important to keep in mind that a well-diversified portfolio with a time horizon matching your goals remains the best path to achieve those goals going forward.
All information according to Bloomberg, unless stated otherwise.
Disclosure: Certain sections of this commentary contain forward-looking statements based on our reasonable expectations, estimates, projections, and assumptions. Forward-looking statements are not guarantees of future performance and involve certain risks and uncertainties, which are difficult to predict. Past performance is not indicative of future results. Diversification does not assure a profit or protect against loss in declining markets. All indices are unmanaged and investors cannot invest directly into an index. The Dow Jones Industrial Average is a price-weighted average of 30 actively traded blue-chip stocks. The S&P 500 Index is a broad-based measurement of changes in stock market conditions based on the average performance of 500 widely held common stocks. The Nasdaq Composite Index measures the performance of all issues listed in the Nasdaq Stock Market, except for rights, warrants, units, and convertible debentures. The MSCI EAFE Index is a float-adjusted market capitalization index designed to measure developed market equity performance, excluding the U.S. and Canada. The MSCI Emerging Markets Index is a market capitalization-weighted index composed of companies representative of the market structure of 26 emerging market countries in Europe, Latin America, and the Pacific Basin. It excludes closed markets and those shares in otherwise free markets that are not purchasable by foreigners. The Bloomberg Barclays Aggregate Bond Index is an unmanaged market value-weighted index representing securities that are SEC-registered, taxable, and dollar-denominated. It covers the U.S. investment-grade fixed-rate bond market, with index components for a combination of the Bloomberg Barclays government and corporate securities, mortgage-backed pass-through securities, and asset-backed securities. The Bloomberg Barclays U.S. Corporate High Yield Index covers the USD-denominated, non-investment-grade, fixed-rate, taxable corporate bond market. Securities are classified as high-yield if the middle rating of Moody’s, Fitch, and S&P is Ba1/BB+/BB+ or below.
Mark Gallagher is a financial advisor located at Gallagher Financial Services at 2586 East 7th Ave. Suite #304, North Saint Paul, MN 55109. He offers securities and advisory services as an Investment Adviser Representative of Commonwealth Financial Network®, Member FINRA/SIPC, a Registered Investment Adviser. He can be reached at 651-774-8759 or at mark@markgallagher.com.
Authored by Brad McMillan, CFA®, CAIA, MAI, managing principal, chief investment officer, and Sam Millette, fixed income analyst, at Commonwealth Financial Network®.
© 2019 Commonwealth Financial Network®