Market Update for the Month Ending October 31, 2018

Presented by Mark Gallagher

More tricks than treats for markets in October
Unfortunately, October lived up to its scary reputation for the markets. Here in the U.S., all three major indices were down for the month. The Nasdaq Composite fared worst with a 9.16-percent loss. Meanwhile, the S&P 500 and Dow Jones Industrial Average lost 6.84 percent and 4.98 percent, respectively.

Slowing growth and a change in sentiment with regard to large technology companies drove the stock sell-off. The big tech names have been a major driver of returns throughout the year. As such, a pullback here had a disproportionate impact on the broader markets. From a technical perspective, all three indices finished the month below their 200-day moving averages. But a rally at month-end cut losses and moved them back toward the trend line.

Given this partial recovery, there is reason to believe that the sell-off may have been a bit overdone. For example, fundamentals for U.S. companies remain strong. According to FactSet (as of October 26, 2018), with 48 percent of S&P 500 companies reporting, the blended average earnings growth rate was 22.5 percent. This result is an improvement from the beginning of the month, when analysts projected earnings growth of 19.3 percent. In the long run, fundamentals drive performance, so these better-than-expected results are encouraging.

International markets also experienced volatility. The MCSI EAFE Index fell 7.96 percent, and the MSCI Emerging Markets Index declined by 8.70 percent. From a technical perspective, both indices remained well below their 200-day moving averages, as they have for the past few months. Political concerns in Europe and a strengthening dollar contributed to the losses seen in foreign markets.

Even fixed income markets fell in October, albeit for different reasons. The Bloomberg Barclays U.S. Aggregate Bond Index dropped by 0.79 percent, driven by rising interest rates. The 10-year Treasury yield ended September at 3.05 percent. It reached a high of 3.23 percent midmonth, before finishing October at 3.15 percent. This increase was caused in large part by rising inflation concerns.

High-yield fixed income also had a rough start to the quarter. The Bloomberg Barclays U.S. Corporate High Yield Index fell 1.60 percent in October. The high cost of capital and a risk-off stance by investors caused turbulence in this historically volatile asset class.

Slowing economic growth
October’s data painted a picture of slower growth throughout the economy. Third-quarter gross domestic product growth came in at 3.5 percent (annualized). This result was down from 4.2 percent in the second quarter. The pullback from the torrid pace of the second quarter is a bit disappointing. But it was also expected and still represents a healthy level of growth.

One of the major drivers of slower economic growth was a decrease in consumer spending. Retail sales disappointed for the second straight month in September, with a modest gain of 0.1 percent. This might indicate that the high levels of spending we saw in the second quarter were unsustainable. Despite the slowdown, spending growth remains at levels that will support continued economic growth for the time being.

Slowing wage income growth likely drove this slower spending growth. In September, only 134,000 new jobs were added, the worst monthly result since September 2017. Wage growth also declined to 2.8 percent on an annualized basis. The news turned around for October, however, as employers added 250,000 jobs, and annual wage income growth rebounded to 3.1 percent. The hurricanes in September and October may have distorted the results for both months, but there is a real prospect for job growth to continue at a strong pace through the rest of the year. Still, there may be constraints given the record number of job openings in the country and an unemployment rate of 3.7 percent.

Housing sales disappoint
With the economy growing but slowing, the housing market also extended its slowdown. Both new and existing home sales fell in September, as higher mortgage rates discouraged would-be buyers. Slower demand growth also resulted in relatively large growth in available housing supply in the third quarter. As you can see in Figure 1, supply grew at a modest rate in the first half of the year. But in the third quarter, housing supply grew more than 15 percent, the second-fastest rate since the last recession.

Figure 1. Monthly Supply of Housing in the U.S. (Quarterly Change), 2008–2018

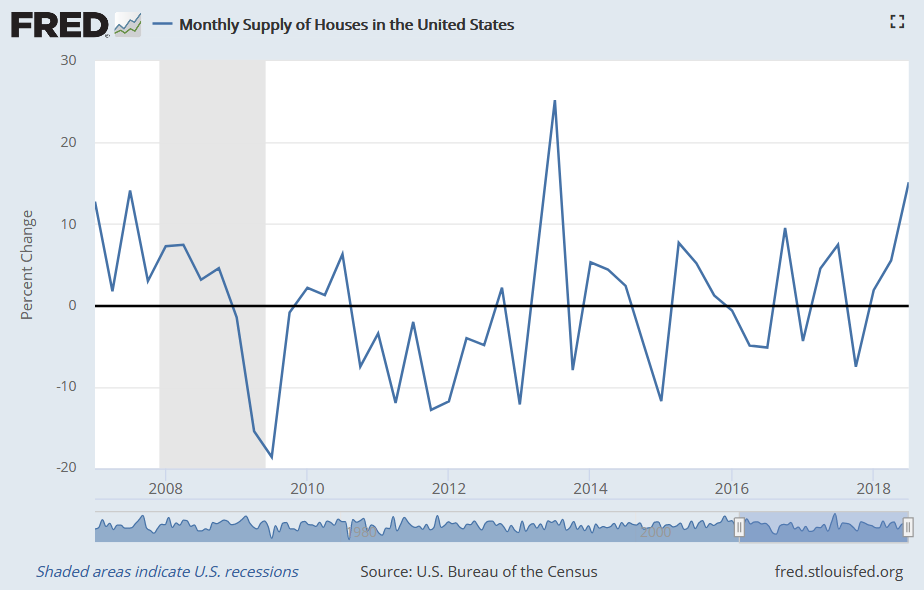
Economists have cited a lack of supply as one of the reasons for the slowdown in housing this year. This time, however, lack of supply was not the cause. The decline in housing sales in September was disappointing, but there may be a lag between increased supply and sales growth. The recent hurricanes have also likely had an effect, as they did on jobs. So, October’s data will be worth watching. Home builders remain confident in the market, so things may pick up again.

Political risks take center stage
Once again, we’ve seen the major effect that politics can have on the markets. Here in the U.S., the upcoming midterm elections have generated a lot of media coverage and increased public uncertainty. But from an investment perspective, it does not matter who ends up controlling the House and the Senate. Any result is likely to be positive for the markets as the uncertainty subsides and the policy path forward becomes clearer. Historically, markets have performed well following midterms. As such, and given the usual positive year-end trends, tailwinds may resume after the midterms are over.

From an international perspective, concerns surrounding a global slowdown spooked the markets. Brexit, as well as the struggle between the Italian government and the European Union, has increased political uncertainty and economic fears in Europe. Further, German Chancellor Angela Merkel announced she will be stepping down as head of her party at the end of 2018. This move leaves the door open for new leadership in Germany for the first time in almost two decades. German leadership has been a major source of stability during Merkel’s time in office, so this will be a closely followed transition.

Last but not least, the ongoing trade disputes between the U.S. and China continue to rattle markets. With a new round of tariffs pending, and companies trying to deal with the effect, this remains a source of risk.

Short-term risks remain, but fundamentals are strong
Concerns over a slowing global economy, elections, trade, and rising interest rates could affect the markets. As such, the volatility seen in October could continue. That said, we have also seen strong corporate earnings growth and solid economic data. Plus, economic growth has remained steady, even through the slowdown. Given these healthy fundamentals, we are well positioned to weather any further volatility.

It’s also important to keep in mind that the uncertainty will subside. The midterms will pass, and Europe will likely find a deal again. Even a trade agreement remains possible, which would substantially calm markets.

Of course, short-term volatility is concerning and the risks are real. But when you look at the big picture, things look good right now. Given the otherwise healthy state of the economy, prospects remain positive. Even if there is more volatility ahead, over the long term, a well-diversified portfolio matched with an investor’s time horizon offers the best path to reaching financial goals.

All information according to Bloomberg, unless stated otherwise.

Disclosure: Certain sections of this commentary contain forward-looking statements based on our reasonable expectations, estimates, projections, and assumptions. Forward-looking statements are not guarantees of future performance and involve certain risks and uncertainties, which are difficult to predict. Past performance is not indicative of future results. Diversification does not assure a profit or protect against loss in declining markets. All indices are unmanaged and investors cannot invest directly into an index. The Dow Jones Industrial Average is a price-weighted average of 30 actively traded blue-chip stocks. The S&P 500 Index is a broad-based measurement of changes in stock market conditions based on the average performance of 500 widely held common stocks. The Nasdaq Composite Index measures the performance of all issues listed in the Nasdaq Stock Market, except for rights, warrants, units, and convertible debentures. The MSCI EAFE Index is a float-adjusted market capitalization index designed to measure developed market equity performance, excluding the U.S. and Canada. The MSCI Emerging Markets Index is a market capitalization-weighted index composed of companies representative of the market structure of 26 emerging market countries in Europe, Latin America, and the Pacific Basin. It excludes closed markets and those shares in otherwise free markets that are not purchasable by foreigners. The Bloomberg Barclays Aggregate Bond Index is an unmanaged market value-weighted index representing securities that are SEC-registered, taxable, and dollar-denominated. It covers the U.S. investment-grade fixed-rate bond market, with index components for a combination of the Bloomberg Barclays government and corporate securities, mortgage-backed pass-through securities, and asset-backed securities. The Bloomberg Barclays U.S. Corporate High Yield Index covers the USD-denominated, non-investment-grade, fixed-rate, taxable corporate bond market. Securities are classified as high-yield if the middle rating of Moody’s, Fitch, and S&P is Ba1/BB+/BB+ or below.

Mark Gallagher is a financial advisor located at Gallagher Financial Services at 2586 East 7th Ave. Suite #304, North Saint Paul, MN 55109. He offers securities and advisory services as an Investment Adviser Representative of Commonwealth Financial Network®, Member FINRA/SIPC, a Registered Investment Adviser. He can be reached at 651-774-8759 or at mark@markgallagher.com.

Authored by Brad McMillan, CFA®, CAIA, MAI, managing principal, chief investment officer, and Sam Millette, fixed income analyst, at Commonwealth Financial Network®.

© 2018 Commonwealth Financial Network®

Weekly Market Update, November 5, 2018

Presented by Mark Gallagher

General market news
• As expected, the volatility in the markets continued. The 10-year Treasury yield was back up to 3.20 percent on Monday morning after being as low as 3.05 percent last week. Meanwhile, the 30-year opened at 3.44 percent and the 2-year at 2.89 percent. With elections on Tuesday and the Federal Reserve (Fed) rate announcement on Thursday, the market will be full of new data this week—and we can expect continued volatility in interest rates.
• Global markets were up across the board as they recovered from the sell-off at the end of October. There were several reasons for the support, including strong earnings and share buybacks following the end of the blackout period. Despite missing consensus estimates, Facebook’s earnings proved to be a positive contribution to the FANG stocks (i.e., Facebook, Amazon, Netflix, and Google). Additionally, according to FactSet, 74 percent of S&P 500 companies are now reporting a blended growth rate of 24.9 percent, which is higher than the expected 19.3 percent at the end of September. General Motors (GM), DowDuPont (DWDP), and Coca-Cola (KO) were among those that beat their earnings estimates.
• U.S.-China trade talks were mixed last week. President Trump threatened $257 billion in additional tariffs if a deal is not completed following the upcoming G20 meeting. Despite this threat, President Trump tweeted out that his discussions with Chinese President Xi Jinping were “moving along nicely.”
• Last week was a busy one for economic updates. On Monday, personal spending growth came in at 0.4 percent, while personal income rose by 0.2 percent. These results follow solid growth for both figures the month before.
• On Thursday, the Institute for Supply Management (ISM) Manufacturing index declined slightly, going from 59 to 57.7. This still represents a healthy level of confidence for manufacturers.
• On Friday, the October employment report was released. Overall, 250,000 new jobs were added during the month, and the unemployment rate stayed steady at 3.7 percent. Average hourly earnings rose to 3.1 percent on a year-over-year basis.

Equity Index Week-to-Date Month-to-Date Year-to-Date 12-Month
S&P 500 2.45% 0.43% 3.45% 7.60%
Nasdaq Composite 2.66% 0.70% 7.46% 10.71%
DJIA 2.36% 0.62% 4.05% 9.89%
MSCI EAFE 3.36% 1.22% –7.74% –5.79%
MSCI Emerging Markets 6.09% 4.27% –11.83% –9.11%
Russell 2000 4.35% 2.43% 1.82% 4.76%

Source: Bloomberg


Fixed Income Index Month-to-Date Year-to-Date 12-Month
U.S. Broad Market –0.28% –2.65% –2.46%
U.S. Treasury –0.28% –2.41% –2.41%
U.S. Mortgages –0.37% –2.06% –1.94%
Municipal Bond –0.27% –1.28% –0.80%

Source: Morningstar Direct

What to look forward to
This will be a relatively slow week for economic news.

On Monday, the ISM Nonmanufacturing index pulled back slightly to 60.3, as expected. This result comes after a surprise increase in September to 61.6, a 21-year high. This is a diffusion index, where values greater than 50 indicate expansion. So, even with the small decline, this result remains quite strong. The pullback is due to slowing growth in the service sector. Overall, this result remains a positive indicator for the health of the economy as a whole.

On Friday, the producer prices report will be released. The headline index, which includes energy and food, is expected to rise by 0.2 percent for October, the same as for September. There may be some upside risk here on energy prices and tariff-driven increases in other input prices—especially steel and electronics. The annual change is expected to increase slightly to 2.7 percent from 2.6 percent, indicating that longer-term inflation pressures remain elevated above the Fed’s target range. The core index, which excludes energy and food, is also expected to stay steady at 0.2 percent for October, the same as for September. The annual figure should remain steady at 2.5 percent.

Finally, the University of Michigan consumer sentiment survey will also be released on Friday. It is expected to show confidence pulling back slightly, from 98.6 for October to 97.9 for November. This result would still be high, historically, suggesting that consumers are not yet worried about the effects of a trade war, given the continued strong labor market. This sentiment should continue to support consumer spending and economic growth.

Disclosures: Certain sections of this commentary contain forward-looking statements that are based on our reasonable expectations, estimates, projections, and assumptions. Forward-looking statements are not guarantees of future performance and involve certain risks and uncertainties, which are difficult to predict. All indices are unmanaged and are not available for direct investment by the public. Past performance is not indicative of future results. The S&P 500 is based on the average performance of the 500 industrial stocks monitored by Standard & Poor’s. The Nasdaq Composite Index measures the performance of all issues listed in the Nasdaq Stock Market, except for rights, warrants, units, and convertible debentures. The Dow Jones Industrial Average is computed by summing the prices of the stocks of 30 large companies and then dividing that total by an adjusted value, one which has been adjusted over the years to account for the effects of stock splits on the prices of the 30 companies. Dividends are reinvested to reflect the actual performance of the underlying securities. The MSCI EAFE Index is a float-adjusted market capitalization index designed to measure developed market equity performance, excluding the U.S. and Canada. The MSCI Emerging Markets Index is a market capitalization-weighted index composed of companies representative of the market structure of 26 emerging market countries in Europe, Latin America, and the Pacific Basin. The Russell 2000® Index measures the performance of the 2,000 smallest companies in the Russell 3000® Index. The Bloomberg Barclays US Aggregate Bond Index is an unmanaged market value-weighted performance benchmark for investment-grade fixed-rate debt issues, including government, corporate, asset-backed, and mortgage-backed securities with maturities of at least one year. The U.S. Treasury Index is based on the auctions of U.S. Treasury bills, or on the U.S. Treasury’s daily yield curve. The Bloomberg Barclays US Mortgage Backed Securities (MBS) Index is an unmanaged market value-weighted index of 15- and 30-year fixed-rate securities backed by mortgage pools of the Government National Mortgage Association (GNMA), Federal National Mortgage Association (Fannie Mae), and the Federal Home Loan Mortgage Corporation (FHLMC), and balloon mortgages with fixed-rate coupons. The Bloomberg Barclays US Municipal Index includes investment-grade, tax-exempt, and fixed-rate bonds with long-term maturities (greater than 2 years) selected from issues larger than $50 million.

Mark Gallagher is a financial advisor located at Gallagher Financial Services at 2586 East 7th Ave. Suite #304, North Saint Paul, MN 55109. He offers securities and advisory services as an Investment Adviser Representative of Commonwealth Financial Network®, Member FINRA/SIPC, a Registered Investment Adviser. He can be reached at 651-774-8759 or at mark@markgallagher.com.

Authored by the Investment Research team at Commonwealth Financial Network.

© 2018 Commonwealth Financial Network®

Weekly Market Update, October 29, 2018

Presented by Mark Gallagher

General market news
• The 10-year Treasury yield was back to 3.05 percent late Friday and early Monday; 3.05 percent is a resistance level both on the way up and on the way down. Meanwhile, the 2-year opened at 2.82 percent and the 30-year at 3.23 percent. The 10-year was as high as 3.25 percent two weeks ago when bonds sold off. The volatility in the rates market is a result of global uncertainty and mixed economic numbers.
• U.S. equity markets were largely down last week, as earnings could not dispel investors’ numerous fears, including peak margins, decelerating Chinese growth, and waning benefits from tax reform. Two of the larger companies to report earnings were Amazon (AMZN) and Alphabet (GOOG/GOOGL). Unfortunately, Amazon (the nation’s largest online retailer) did not quell investor fears, as international sales growth and Prime subscribership slowed more than expected. The company also slightly lowered guidance for the holiday quarter. Google cited the strength of the U.S. dollar as a headwind for its miss on revenues. This week will see earnings for Facebook (FB), another large Internet advertiser, and for Apple (AAPL), a large tech retailer. Investors will have a keen eye on their earnings, as these names have been leaders through much of the bull market up until this point.
• There were a number of important data releases last week. On Wednesday, new home sales fell by 5.5 percent in September, as a slowdown in the Northeast affected overall sales.
• On Thursday, September’s durable goods orders came in better than expected, with 0.8-percent growth against expectations for a decline of 1.5 percent.
• On Friday, the first estimate of third-quarter gross domestic product growth was released. Overall economic activity expanded by 3.5 percent on an annualized basis. This result was better than the expected 3.4-percent growth, but it was down from 4.2 percent in the second quarter.

Equity Index Week-to-Date Month-to-Date Year-to-Date 12-Month
S&P 500 –3.93% –8.67% 0.98% 5.85%
Nasdaq Composite –3.78% –10.90% 4.67% 10.46%
DJIA –2.97% –6.60% 1.65% 7.89%
MSCI EAFE –3.87% –9.86% –10.74% –7.83%
MSCI Emerging Markets –3.27% –10.27% –16.90% –12.83%
Russell 2000 –3.76% –12.50% –2.42% 0.35%

Source: Bloomberg


Fixed Income Index Month-to-Date Year-to-Date 12-Month
U.S. Broad Market –0.34% –1.93% –1.17%
U.S. Treasury –0.03% –1.70% –1.09%
U.S. Mortgages –0.28% –1.35% –0.75%
Municipal Bond –0.41% –0.80% –0.26%

Source: Morningstar Direct

What to look forward to
This is a very busy week for economic news. We’ll get looks at consumer income, spending, and confidence, as well as manufacturing industry sentiment, the trade balance, and, most important, the job market.

On Monday, the personal income and spending report will be released. Personal income is expected to rise by 0.4 percent in September, up from 0.3 percent in August, on faster wage growth. There may be some downside risk here, as hiring slowed last month. Personal spending is also expected to rise. It should go from 0.3 percent in August to 0.4 percent in September on a spike in auto sales to replace those damaged by Hurricane Florence. Here, there may be some upside risk. This would remain a healthy level of spending growth and would be well supported by income growth.

On Tuesday, the Conference Board Consumer Confidence Index is expected to pull back slightly, going from 138.4 to a still very high 136.2 on rising gas prices. This result would still be close to the highest levels in the past 20 years and would be supportive of continued growth.

On Thursday, the Institute for Supply Management Manufacturing index is expected to drop slightly. It should go from 59.8 to 59.4, in another tick down after an unexpected surge in August. This is a diffusion index, where values above 50 indicate expansion and below 50 indicate contraction. So, even with the small decline, this level remains quite strong. The pullback is expected to come from slowing global growth in general and the recent appreciation in the dollar specifically, which has been increasing the costs of U.S. products to foreign buyers. Uncertainty over trade policy remains a headwind as well. With manufacturing growth slowing, there may be some downside risk to this indicator. Even with a larger pullback, however, this would still remain positive for the economy as a whole.

On Friday, the international trade report is expected to show the trade deficit improved slightly, going from $53.2 billion to $52.8 billion. We already know from the advance report that the trade deficit in goods widened, as export growth has now dropped back even as imports have increased. As such, there may be some additional downside risk to this report. Overall, if the numbers come in as expected, trade will likely be a drag on fourth-quarter growth.

Finally, on Friday, the employment report is expected to show that job growth rebounded to a very healthy 190,000 in October from a weak September report of 134,000. The unemployment rate is expected to stay at a very low 3.7 percent. Wage growth is expected to pull back a bit, from 0.3 percent in September to 0.2 percent for October, on a monthly basis; on an annual basis, however, wage growth is expected to rise from 2.8 percent to 3.1 percent on base effects. There is some downside risk here, depending on the impact from Hurricane Michael. But if the numbers come in as expected, this would be another healthy report and signal continued economic growth. It would also likely support another rate hike from the Federal Reserve in December.

Disclosures: Certain sections of this commentary contain forward-looking statements that are based on our reasonable expectations, estimates, projections, and assumptions. Forward-looking statements are not guarantees of future performance and involve certain risks and uncertainties, which are difficult to predict. All indices are unmanaged and are not available for direct investment by the public. Past performance is not indicative of future results. The S&P 500 is based on the average performance of the 500 industrial stocks monitored by Standard & Poor’s. The Nasdaq Composite Index measures the performance of all issues listed in the Nasdaq Stock Market, except for rights, warrants, units, and convertible debentures. The Dow Jones Industrial Average is computed by summing the prices of the stocks of 30 large companies and then dividing that total by an adjusted value, one which has been adjusted over the years to account for the effects of stock splits on the prices of the 30 companies. Dividends are reinvested to reflect the actual performance of the underlying securities. The MSCI EAFE Index is a float-adjusted market capitalization index designed to measure developed market equity performance, excluding the U.S. and Canada. The MSCI Emerging Markets Index is a market capitalization-weighted index composed of companies representative of the market structure of 26 emerging market countries in Europe, Latin America, and the Pacific Basin. The Russell 2000® Index measures the performance of the 2,000 smallest companies in the Russell 3000® Index. The Bloomberg Barclays US Aggregate Bond Index is an unmanaged market value-weighted performance benchmark for investment-grade fixed-rate debt issues, including government, corporate, asset-backed, and mortgage-backed securities with maturities of at least one year. The U.S. Treasury Index is based on the auctions of U.S. Treasury bills, or on the U.S. Treasury’s daily yield curve. The Bloomberg Barclays US Mortgage Backed Securities (MBS) Index is an unmanaged market value-weighted index of 15- and 30-year fixed-rate securities backed by mortgage pools of the Government National Mortgage Association (GNMA), Federal National Mortgage Association (Fannie Mae), and the Federal Home Loan Mortgage Corporation (FHLMC), and balloon mortgages with fixed-rate coupons. The Bloomberg Barclays US Municipal Index includes investment-grade, tax-exempt, and fixed-rate bonds with long-term maturities (greater than 2 years) selected from issues larger than $50 million.


Mark Gallagher is a financial advisor located at Gallagher Financial Services at 2586 East 7th Ave. Suite #304, North Saint Paul, MN 55109. He offers securities and advisory services as an Investment Adviser Representative of Commonwealth Financial Network®, Member FINRA/SIPC, a Registered Investment Adviser. He can be reached at 651-774-8759 or at mark@markgallagher.com.

Authored by the Investment Research team at Commonwealth Financial Network.

© 2018 Commonwealth Financial Network®

Weekly Market Update, October 22, 2018

Presented by Mark Gallagher

General market news
• The 10-year Treasury yield opened at 3.19 percent early Monday, while the 30-year opened at 3.37 percent and the 2-year at 2.90 percent. The yield curve flattened last week. It is off its recent lows of late September but lower than the level seen after the Federal Reserve (Fed) raised rates a couple of weeks ago. With the Fed apparently ready to raise rates again in December, rate volatility is likely as the market attempts to balance economic growth and the effect of Fed action.
• U.S. equity markets were mixed last week, as investors favored more defensive investments. Not surprising, then, the more defensive Dow led the way for the three major U.S. markets, while the tech- and growth-oriented Nasdaq Composite Index lagged. Consumer staples, REITs, and utilities were among the top three performers. Consumer discretionary, energy, and materials were among the top laggards.
• After last week’s steep sell-off, earnings still remain strong at approximately 19.5 percent for the third quarter, per FactSet estimates. Although this result is a sign that strength remains for U.S. markets, China saw its gross domestic product (GDP) growth fall to 6.5 percent in the third quarter compared with 6.7 percent in the second quarter. The Chinese economy continues to take actions to promote growth, including lowering its reserve requirement ratio.
• Last week saw the release of only a handful of notable economic updates. On Monday, September’s retail sales data came in lower than expected, with 0.1-percent growth for the month. This follows several months of strong growth, so this is not an immediate concern but should be monitored.
• On Wednesday, both housing starts and building permits declined, as the slowdown in new housing growth continues.
• On Friday, existing home sales disappointed, falling 3.4 percent against expectations for a more modest loss of 0.9 percent.


Equity Index Week-to-Date Month-to-Date Year-to-Date 12-Month
S&P 500 0.05% –4.93% 5.11% 10.13%
Nasdaq Composite –0.64% –7.40% 8.78% 13.96%
DJIA 0.45% –3.74% 4.76% 12.36%
MSCI EAFE –0.06% –6.23% –7.15% –4.78%
MSCI Emerging Markets –0.88% –7.24% –14.09% –10.59%
Russell 2000 –0.29% –9.08% 1.39% 3.96%

Source: Bloomberg


Fixed Income Index Month-to-Date Year-to-Date 12-Month
U.S. Broad Market –0.88% –2.46% –2.21%
U.S. Treasury –0.70% –2.35% –2.37%
U.S. Mortgages –0.88% –1.94% –1.74%
Municipal Bond –0.72% –1.11% –1.04%

Source: Morningstar Direct

What to look forward to
This week is a busy one on the economic front, giving us a final look at housing for the month, as well as whether business investment continues to improve. We’ll also get a preliminary look at how the economy performed in the third quarter.

On Wednesday, the new home sales report is expected to stay steady at 629,000. This result would be indicative of a potential pause in the ongoing housing slowdown. If the number comes in as expected, it will also signal that while housing growth continues to slow, the downtrend remains under control in one of the most economically impactful sectors.

On Thursday, the durable goods orders report will be released. The headline index is expected to pull back after a significant bounce last month. It should go from a 4.4-percent gain in August to a 1-percent decline in September, on a decrease in transportation orders. This headline index is notoriously volatile, as we can see from these numbers. The core index, which excludes transportation and is a much better economic indicator, is expected to improve from flat growth in August to 0.3-percent growth in September, on growing business investment. This would be a healthy level of growth.

Finally, on Friday, the first estimate of third-quarter growth in GDP is expected to show that economic growth slowed from 4.2 percent in the second quarter to a still healthy 3.3 percent in the third quarter. While there was some volatility in trade-related components, that is likely to have largely netted out. As such, the slowdown would be due to slower domestic economic activity. If the number comes in as expected, it would show continued healthy growth but also suggest that growth at the level of last quarter was not sustainable.

Disclosures: Certain sections of this commentary contain forward-looking statements that are based on our reasonable expectations, estimates, projections, and assumptions. Forward-looking statements are not guarantees of future performance and involve certain risks and uncertainties, which are difficult to predict. All indices are unmanaged and are not available for direct investment by the public. Past performance is not indicative of future results. The S&P 500 is based on the average performance of the 500 industrial stocks monitored by Standard & Poor’s. The Nasdaq Composite Index measures the performance of all issues listed in the Nasdaq Stock Market, except for rights, warrants, units, and convertible debentures. The Dow Jones Industrial Average is computed by summing the prices of the stocks of 30 large companies and then dividing that total by an adjusted value, one which has been adjusted over the years to account for the effects of stock splits on the prices of the 30 companies. Dividends are reinvested to reflect the actual performance of the underlying securities. The MSCI EAFE Index is a float-adjusted market capitalization index designed to measure developed market equity performance, excluding the U.S. and Canada. The MSCI Emerging Markets Index is a market capitalization-weighted index composed of companies representative of the market structure of 26 emerging market countries in Europe, Latin America, and the Pacific Basin. The Russell 2000® Index measures the performance of the 2,000 smallest companies in the Russell 3000® Index. The Bloomberg Barclays US Aggregate Bond Index is an unmanaged market value-weighted performance benchmark for investment-grade fixed-rate debt issues, including government, corporate, asset-backed, and mortgage-backed securities with maturities of at least one year. The U.S. Treasury Index is based on the auctions of U.S. Treasury bills, or on the U.S. Treasury’s daily yield curve. The Bloomberg Barclays US Mortgage Backed Securities (MBS) Index is an unmanaged market value-weighted index of 15- and 30-year fixed-rate securities backed by mortgage pools of the Government National Mortgage Association (GNMA), Federal National Mortgage Association (Fannie Mae), and the Federal Home Loan Mortgage Corporation (FHLMC), and balloon mortgages with fixed-rate coupons. The Bloomberg Barclays US Municipal Index includes investment-grade, tax-exempt, and fixed-rate bonds with long-term maturities (greater than 2 years) selected from issues larger than $50 million.

Mark Gallagher is a financial advisor located at Gallagher Financial Services at 2586 East 7th Ave. Suite #304, North Saint Paul, MN 55109. He offers securities and advisory services as an Investment Adviser Representative of Commonwealth Financial Network®, Member FINRA/SIPC, a Registered Investment Adviser. He can be reached at 651-774-8759 or at mark@markgallagher.com.

Authored by the Investment Research team at Commonwealth Financial Network.

© 2018 Commonwealth Financial Network®