Weekly Market Update, July 16, 2018

Presented by Mark Gallagher 

General market news
• The Treasury yield curve continues to flatten, with the 10-year, 30-year, and 2-year Treasuries coming in on Monday morning at 2.83 percent, 2.94 percent, and 2.60 percent, respectively. The difference in yield between the 2-year and 30-year Treasuries is at a cycle low of 34 basis points (bps). The difference in yield between the 5-year and 10-year Treasuries is down to 9.7 bps, and the difference between the 2-year and 5-year Treasuries is 14.8 bps.
• In a role reversal from the prior week, small-cap stocks and the Russell 2000 were among the laggards. The Dow Jones Industrial Average and Nasdaq Composite, on the other hand, rose as the market favored a risk-on rally led by technology, industrials, and consumer discretionary. Positive second-quarter earnings sentiment was cited as one of the main reasons for this strong performance, with FactSet showing second-quarter S&P 500 EPS growth of 20 percent. This level of growth would be the second highest since the third quarter of 2010 and would be due in part to the tax overhaul and higher buyback levels throughout the quarter.
• Amazon bolstered consumer discretionary performance with its announcement of a new program that would allow entrepreneurs to start their own delivery business. This program should reinforce Amazon’s last-mile efforts, and many believe it will also serve as a bargaining chip when negotiating delivery costs with other providers (e.g., UPS and FedEx).
• Last week was a quiet one for economic updates. On Wednesday, the Producer Price Index came in higher than expected, with 0.3-percent month-over-month growth dragging the annual figure to 3.1 percent. On Thursday, the Consumer Price Index also showed strong inflation levels, with a 2.9-percent annual gain.
• On Friday, the University of Michigan consumer sentiment survey declined slightly from 98.2 to 97.1. This result still represents a very strong reading.


Equity Index Week-to-Date Month-to-Date Year-to-Date 12-Month
S&P 500 1.55% 3.13% 5.86% 16.67%
Nasdaq Composite 1.79% 4.23% 14.01% 26.09%
DJIA 2.32% 3.16% 2.41% 18.75%
MSCI EAFE 0.17% 0.74% –1.69% 6.93%
MSCI Emerging Markets 1.70% 1.01% –5.66% 6.06%
Russell 2000 –0.40% 2.71% 10.59% 19.84%

Source: Bloomberg


Fixed Income Index Month-to-Date Year-to-Date 12-Month
U.S. Broad Market 0.42% –1.20% –0.06%
U.S. Treasury 0.23% –0.85% –0.36%
U.S. Mortgages 0.23% –0.73% 0.22%
Municipal Bond 0.35% 0.10% 1.76%

Source: Morningstar Direct

What to look forward to
This will be a busy week for economic news, with wide-ranging reports.

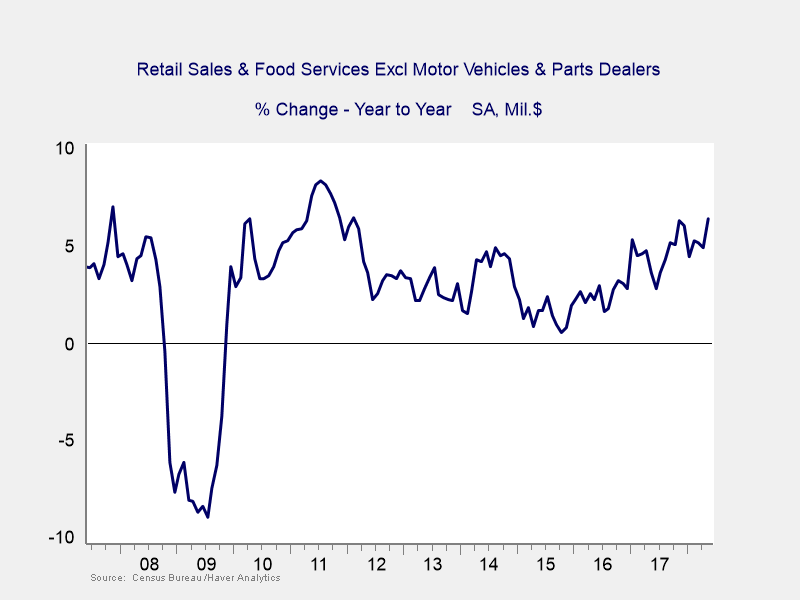
On Monday, the retail sales report showed growth of 0.5 percent for June. This number is down from May’s 0.8-percent growth but is still at a very strong level. This result is supported by a recovery in auto sales growth and is in line with expectations. Core retail sales, which exclude autos, also showed slower growth. The core number was down from 0.9 percent in May to 0.4 percent in June, coming in slightly above expectations for 0.3-percent growth. After a strong series of gains, these numbers still represent healthy growth and confident consumers who continue to spend.

On Tuesday, the industrial production report is expected to tick up. After a decline of 0.1 percent in May, this report should show a 0.5-percent gain for June due to an increase in oil drilling as prices rise. Manufacturing is likely to show an even bigger improvement. Coming off of a 0.6-percent decline in May, which was largely the result of a fire that disrupted auto industry supply chains, this report is expected to rebound for a gain of 0.5 percent in June. If the numbers come in as expected, they would signal continued economic growth.

Chair Powell will testify before the Senate on Tuesday and the House on Wednesday in the regular semiannual session. The markets will be looking for the Federal Reserve’s take on the rising trade confrontation and its effects on the economy, as well as what it may mean for interest rates. Currently, no changes are expected.

We’ll also get a look at the housing sector on Tuesday with the release of the National Association of Home Builders (NAHB) Housing Market Index and on Wednesday with the housing starts report. After last month’s pullback due to a drop in lumber prices, the NAHB index is expected to tick up slightly from 68 in June to 69 in July. Housing starts should drop slightly from 1.35 million in May to 1.33 million (annualized) in June. This result would be due to a decline in single-family building permits in prior months. If the housing starts number comes in as expected, it will mean that housing may be experiencing a minor slowdown.

Disclosures: Certain sections of this commentary contain forward-looking statements that are based on our reasonable expectations, estimates, projections, and assumptions. Forward-looking statements are not guarantees of future performance and involve certain risks and uncertainties, which are difficult to predict. All indices are unmanaged and are not available for direct investment by the public. Past performance is not indicative of future results. The S&P 500 is based on the average performance of the 500 industrial stocks monitored by Standard & Poor’s. The Nasdaq Composite Index measures the performance of all issues listed in the Nasdaq Stock Market, except for rights, warrants, units, and convertible debentures. The Dow Jones Industrial Average is computed by summing the prices of the stocks of 30 large companies and then dividing that total by an adjusted value, one which has been adjusted over the years to account for the effects of stock splits on the prices of the 30 companies. Dividends are reinvested to reflect the actual performance of the underlying securities. The MSCI EAFE Index is a float-adjusted market capitalization index designed to measure developed market equity performance, excluding the U.S. and Canada. The MSCI Emerging Markets Index is a market capitalization-weighted index composed of companies representative of the market structure of 26 emerging market countries in Europe, Latin America, and the Pacific Basin. The Russell 2000® Index measures the performance of the 2,000 smallest companies in the Russell 3000® Index. The Bloomberg Barclays US Aggregate Bond Index is an unmanaged market value-weighted performance benchmark for investment-grade fixed-rate debt issues, including government, corporate, asset-backed, and mortgage-backed securities with maturities of at least one year. The U.S. Treasury Index is based on the auctions of U.S. Treasury bills, or on the U.S. Treasury’s daily yield curve. The Bloomberg Barclays US Mortgage Backed Securities (MBS) Index is an unmanaged market value-weighted index of 15- and 30-year fixed-rate securities backed by mortgage pools of the Government National Mortgage Association (GNMA), Federal National Mortgage Association (Fannie Mae), and the Federal Home Loan Mortgage Corporation (FHLMC), and balloon mortgages with fixed-rate coupons. The Bloomberg Barclays US Municipal Index includes investment-grade, tax-exempt, and fixed-rate bonds with long-term maturities (greater than 2 years) selected from issues larger than $50 million.

Mark Gallagher is a financial advisor located at Gallagher Financial Services at 2586 East 7th Ave. Suite #304, North Saint Paul, MN 55109. He offers securities and advisory services as an Investment Adviser Representative of Commonwealth Financial Network®, Member FINRA/SIPC, a Registered Investment Adviser. He can be reached at 651-774-8759 or at mark@markgallagher.com.
Authored by the Investment Research team at Commonwealth Financial Network.

© 2018 Commonwealth Financial Network®


Weekly Market Update, July 9, 2018

Presented by Mark Gallagher

General market news
• On Monday morning, the 10-year, 30-year, and 2-year Treasuries opened at 2.82 percent, 2.93 percent, and 2.53 percent, respectively. The difference between short rates and long rates is at the narrowest level we’ve seen during the current economic expansion—pushing the yield curve flatter. Historically, the curve has been a good indicator of oncoming recessions, and it’s now beginning to show signs that one may be on the horizon.
• After two consecutive weeks of losses for U.S. markets, performance turned around last week on news of a strong jobs report and generally positive sentiment from the Federal Open Market Committee meeting minutes. The Russell 2000 led the way up, followed by the Nasdaq Composite. Biogen (BIIB) was up more than 23 percent following positive results from its experimental Alzheimer’s drug, BAN2401. This move helped push health care to the top spot for sector performance, with utilities and technology rounding out the top three. Energy, financials, and materials were among the worst-performing sectors.
• The U.S. implemented $34 billion in tariffs on Chinese exports on Friday. China was quick to answer back with $34 billion of its own tariffs on 545 U.S. exports, including soybeans, cotton, and tobacco. Both moves could increase risk and uncertainty in the markets.
• Last week’s major data releases came in better than expected, as business confidence rose and jobs were added to the economy. On Monday, the Institute for Supply Management (ISM) Manufacturing index increased to 60.2 against expectations for a slight decline. This optimism was echoed by the ISM Nonmanufacturing index, which also moved higher despite expectations for a slight pullback.
• On Friday, the June employment report showed that 213,000 new jobs were added, against expectations for 200,000. In addition, wage growth remained steady at 2.7 percent on an annual basis.


Equity Index Week-to-Date Month-to-Date Year-to-Date 12-Month
S&P 500 1.56% 1.56% 4.25% 16.73%
Nasdaq Composite 2.40% 2.40% 12.00% 27.64%
DJIA 0.82% 0.82% 0.09% 17.33%
MSCI EAFE 0.57% 0.57% –1.85% 8.02%
MSCI Emerging Markets –0.68% –0.68% –7.24% 8.04%
Russell 2000 3.12% 3.12% 11.03% 22.47%

Source: Bloomberg

Fixed Income Index Month-to-Date Year-to-Date 12-Month
U.S. Broad Market 0.24% –1.38% 0.21%
U.S. Treasury 0.18% –0.90% –0.02%
U.S. Mortgages 0.10% –0.86% 0.50%
Municipal Bond 0.14% –0.11% 1.89%

Source: Morningstar Direct

What to look forward to
This week’s releases will focus on prices, as well as provide a look into consumer confidence.

On Wednesday, the Producer Price Index is expected to rise by 0.2 percent in the headline number, which includes energy and food. This result would be down from a 0.5-percent increase in May and would be due largely to flat gasoline prices and tariff-driven increases in other input prices. The annual change for the headline index is expected to remain stable at 3.1 percent, indicating that longer-term pressures are keeping inflation elevated above the Federal Reserve’s (Fed’s) 2-percent target. The core number, which excludes energy and food, is expected to tick up from 0.1 percent in May to 0.2 percent in June. The annual figure should remain solid at 2.6 percent. Overall, these figures are steady in aggregate. Beneath the surface, however, tariffs are driving faster input inflation.

On Thursday, the Consumer Price Index is likely to show steady inflation. The headline number is expected to rise by 0.2 percent in June, just as it did in May. The annual figure should increase from 2.8 percent in May to 2.9 percent in June on base effects. Similarly, the core number is expected to remain steady at 0.2 percent for June and tick up from 2.2 percent to 2.3 percent on an annual basis. As with the Producer Price Index, these figures indicate that inflation continues to run above the Fed’s target, driving interest rate increases.

On Friday, we’ll see the University of Michigan consumer confidence survey. It is expected to remain steady at a high 98.2, the same as in June. A small rise is possible, with the stock market moving back up and gas prices holding steady. But those factors may have been offset by rising concerns around trade. In any event, if confidence stays at the current elevated level, it would be a positive signal for continued growth.

Disclosures: Certain sections of this commentary contain forward-looking statements that are based on our reasonable expectations, estimates, projections, and assumptions. Forward-looking statements are not guarantees of future performance and involve certain risks and uncertainties, which are difficult to predict. All indices are unmanaged and are not available for direct investment by the public. Past performance is not indicative of future results. The S&P 500 is based on the average performance of the 500 industrial stocks monitored by Standard & Poor’s. The Nasdaq Composite Index measures the performance of all issues listed in the Nasdaq Stock Market, except for rights, warrants, units, and convertible debentures. The Dow Jones Industrial Average is computed by summing the prices of the stocks of 30 large companies and then dividing that total by an adjusted value, one which has been adjusted over the years to account for the effects of stock splits on the prices of the 30 companies. Dividends are reinvested to reflect the actual performance of the underlying securities. The MSCI EAFE Index is a float-adjusted market capitalization index designed to measure developed market equity performance, excluding the U.S. and Canada. The MSCI Emerging Markets Index is a market capitalization-weighted index composed of companies representative of the market structure of 26 emerging market countries in Europe, Latin America, and the Pacific Basin. The Russell 2000® Index measures the performance of the 2,000 smallest companies in the Russell 3000® Index. The Bloomberg Barclays US Aggregate Bond Index is an unmanaged market value-weighted performance benchmark for investment-grade fixed-rate debt issues, including government, corporate, asset-backed, and mortgage-backed securities with maturities of at least one year. The U.S. Treasury Index is based on the auctions of U.S. Treasury bills, or on the U.S. Treasury’s daily yield curve. The Bloomberg Barclays US Mortgage Backed Securities (MBS) Index is an unmanaged market value-weighted index of 15- and 30-year fixed-rate securities backed by mortgage pools of the Government National Mortgage Association (GNMA), Federal National Mortgage Association (Fannie Mae), and the Federal Home Loan Mortgage Corporation (FHLMC), and balloon mortgages with fixed-rate coupons. The Bloomberg Barclays US Municipal Index includes investment-grade, tax-exempt, and fixed-rate bonds with long-term maturities (greater than 2 years) selected from issues larger than $50 million.


Mark Gallagher is a financial advisor located at Gallagher Financial Services at 2586 East 7th Ave. Suite #304, North Saint Paul, MN 55109. He offers securities and advisory services as an Investment Adviser Representative of Commonwealth Financial Network®, Member FINRA/SIPC, a Registered Investment Adviser. He can be reached at 651-774-8759 or at mark@markgallagher.com.

Authored by the Investment Research team at Commonwealth Financial Network.

© 2018 Commonwealth Financial Network®


Market Update for the Quarter Ending June 30, 2018

Presented by Mark Gallagher

Volatile June caps off eventful quarter
June was a volatile month, with earlier gains offset by later losses. Still, both the S&P 500 Index and the Nasdaq Composite ended the month in positive territory. The S&P 500 rose 0.62 percent during the month, while the Nasdaq led the way with a gain of 0.98 percent. The Dow Jones Industrial Average was the lone exception, as it declined 0.49 percent.

All three U.S. indices were positive for the quarter. The S&P 500 was up 3.43 percent for the period, and the Dow gained 1.26 percent. But the Nasdaq did best, rising 6.61 percent.

Despite the volatility at month-end, the fundamentals for U.S. markets remained positive. According to FactSet, the estimated earnings growth rate for the S&P 500 in the second quarter stands at 20 percent (as of June 29). This would represent the second-highest quarterly earnings growth since 2011. We know that fundamentals drive long-term performance. If companies meet expectations, then this strong second-quarter growth should encourage further performance.

While fundamentals were supportive for the month, technicals were mixed. The S&P 500 and the Nasdaq remained above their long-term trend lines. The Dow, on the other hand, dropped below its trend line for the first time since June 2016. This is worth watching, but a drop like this is not that unusual. In fact, the S&P 500 closed below its 200-day moving average in April before quickly recovering.

Now let’s turn to foreign stocks, which did worse in June than the U.S. markets. The MSCI EAFE Index, which represents developed markets, declined by 1.22 percent during the month. This drop took it from roughly even to a decline of 1.07 percent for the quarter. Emerging markets did even worse. The MSCI Emerging Markets Index declined by 4.09 percent for the month and by 7.73 percent for the quarter, on a rising dollar and growing policy concerns.

Technical factors for international equities also weakened during June. The MSCI EAFE Index spent the second half of the month below its 200-day moving average. This drop came after the European Central Bank announced that it plans to end its stimulus programs and to hike rates within the next year. Emerging markets did even worse from a technical perspective; they spent almost the entire month beneath the trend line.

Fixed income also had a challenging month and quarter, as rising rates negatively affected prices. As expected, the Federal Reserve (Fed) voted to hike the federal funds rate by 25 basis points at its June meeting. Further, the statement released by the Fed was more optimistic about the economy than expected, suggesting that more rate hikes are likely.

The Bloomberg Barclays U.S. Aggregate Bond Index declined by 0.12 percent during the month and by 0.16 percent for the quarter. The 10-year U.S. Treasury yield started the quarter at 2.73 percent. It reached a high of 3.11 percent before ending the quarter at 2.85 percent.

High-yield bonds, which are typically less tied to moves in Treasury rates, had a better month and quarter than did investment-grade fixed income. The Bloomberg Barclays U.S. Corporate High Yield Index gained 0.40 percent during the month and 1.03 percent during the quarter. Spreads remained in the 3-percent to 4-percent range during the quarter, as investors continued to find high-yield bonds attractive.

Employment and spending show strong growth
Most of June’s major data releases painted a picture of stronger growth in the second quarter. Consumers and businesses saw high levels of confidence and spending growth throughout the month. Although consumer confidence did decline slightly in June, both major measures of confidence remain near multidecade highs. Historically, the health of the jobs market has been one of the main factors that influences confidence. So, it is no surprise that confidence remains high after May’s strong employment report.

The economy added 223,000 new jobs in May, beating expectations. The unemployment rate fell to an 18-year low of 3.8 percent, and the underemployment rate declined. Wage growth came in better than expected. It increased to 2.7 percent on an annual basis, close to the highest level since the crisis. Strong employment growth has been a major driver of the ongoing economic expansion, but wage growth has lagged. As such, this uptick in annual wages is very encouraging.

Wage growth is important, but just as important is consumer willingness to spend. Here again, the news was positive. The combination of income growth and high confidence led to faster spending growth. Overall spending grew by 0.6 percent, well above expectations of 0.4 percent. The retail sales data was even better, with 0.8-percent headline growth in May. The core figure, which strips out volatile vehicle purchases, rose by 0.5 percent on a month-over-month basis. This rise brought year-over-year core retail sales growth to its highest level since early 2012, as you can see in Figure 1.

Figure 1. Core Retail Sales, 2007–2018

While consumer spending growth was positive across the board, business spending was mixed. May data was weak, with durable goods orders dropping by 0.7 percent. This drop was due in large part to a dramatic 7-percent decline in the volatile transportation sector. The core figure, which excludes transportation, fell by a more modest 0.3 percent in May. Despite the weak month, a positive revision from 0.9-percent to 1.9-percent growth in April left the quarterly figure looking healthy. The overall trend for business investment remains positive.

Housing a drag on growth
Although the economy is generally healthy, there are signs of slowing growth. After a multiyear period of solid growth—driven by low mortgage rates and relatively affordable prices—housing appears to have slowed.

On the supply side, home builder confidence dropped in June. Here, rising lumber costs and a lack of labor hurt the profitability of new home construction. Building permits, which are the first step for new home construction, echoed the decline in home builder confidence. They fell by 4.6 percent during the month. On the demand side, home buyers appear to be taking rising home costs in stride, as new home sales rose by more than expected in May. Existing home sales dropped slightly, suggesting that declining affordability may be starting to make a difference. Housing growth has historically had a multiplier effect on overall economic growth as new home buyers spend more on furnishings and repairs. So, any slowdown in housing is something that should be monitored closely.

Political risks continue to affect markets
While the economy is growing at a healthy pace, politics and policy present the biggest risks to the financial markets. Again, the news here is a bit of a mixed bag. On a positive note, last month’s major concerns surrounding a euroskeptic government in Italy and the summit between President Trump and North Korea’s Kim Jong-un have largely subsided. But these very real improvements have been overshadowed by growing concerns about trade conflict. These worries have been fueled by the U.S. imposition of tariffs, along with the subsequent retaliatory actions from most major global economies.

It is still too early to know exactly how the trade conflict will play out. The probability remains that a negotiated deal will be reached before matters become much more serious. Nonetheless, effects are already showing up in the economy. If the situation does worsen, it will almost certainly lead to lower levels of growth both domestically and abroad.

Economic growth expected to continue
While rising political risks are a valid concern, the U.S. economy continues to grow at a solid pace. The positive tailwinds from tax reform and the strong jobs market are driving consumer and business spending, which in turn should lead to faster economic growth for the rest of the year.

There are certainly risks to this outlook—namely a slowdown in housing and rising political risks. On the whole, however, things appear to be pretty good right now. Of course, risks can always materialize and affect markets. As such, a well-diversified portfolio that matches goals and time horizons is still the best way to prepare for the future and weather the potential storm.

All information according to Bloomberg, unless stated otherwise.

Disclosure: Certain sections of this commentary contain forward-looking statements based on our reasonable expectations, estimates, projections, and assumptions. Forward-looking statements are not guarantees of future performance and involve certain risks and uncertainties, which are difficult to predict. Past performance is not indicative of future results. Diversification does not assure a profit or protect against loss in declining markets. All indices are unmanaged and investors cannot invest directly into an index. The Dow Jones Industrial Average is a price-weighted average of 30 actively traded blue-chip stocks. The S&P 500 Index is a broad-based measurement of changes in stock market conditions based on the average performance of 500 widely held common stocks. The Nasdaq Composite Index measures the performance of all issues listed in the Nasdaq Stock Market, except for rights, warrants, units, and convertible debentures. The MSCI EAFE Index is a float-adjusted market capitalization index designed to measure developed market equity performance, excluding the U.S. and Canada. The MSCI Emerging Markets Index is a market capitalization-weighted index composed of companies representative of the market structure of 26 emerging market countries in Europe, Latin America, and the Pacific Basin. It excludes closed markets and those shares in otherwise free markets that are not purchasable by foreigners. The Bloomberg Barclays Aggregate Bond Index is an unmanaged market value-weighted index representing securities that are SEC-registered, taxable, and dollar-denominated. It covers the U.S. investment-grade fixed-rate bond market, with index components for a combination of the Bloomberg Barclays government and corporate securities, mortgage-backed pass-through securities, and asset-backed securities. The Bloomberg Barclays U.S. Corporate High Yield Index covers the USD-denominated, non-investment-grade, fixed-rate, taxable corporate bond market. Securities are classified as high-yield if the middle rating of Moody’s, Fitch, and S&P is Ba1/BB+/BB+ or below.

Mark Gallagher is a financial advisor located at Gallagher Financial Services at 2586 East 7th Ave. Suite #304, North Saint Paul, MN 55109. He offers securities and advisory services as an Investment Adviser Representative of Commonwealth Financial Network®, Member FINRA/SIPC, a Registered Investment Adviser. He can be reached at 651-774-8759 or at mark@markgallagher.com.

Authored by Brad McMillan, CFA®, CAIA, MAI, managing principal, chief investment officer, and Sam Millette, fixed income analyst, at Commonwealth Financial Network®.

© 2018 Commonwealth Financial Network®


Weekly Market Update, July 2, 2018

Presented by Mark Gallagher

General market news
• Rates continued to drop last week, with the 10-year Treasury yield falling to a low of 2.82 percent on Friday; it opened Monday morning at 2.84 percent. Similarly, the 30-year Treasury yield hit a low of 2.95 percent last week, but it opened at 2.99 percent on Monday.
• All three major U.S. markets were down in the past week, as markets sold off broadly on continued trade concerns and the flattening of the yield curve.
• Chinese stocks entered bear territory, as the reserve ratio requirement was cut by 50 basis points (bps) in an effort to trigger increased lending. Further, the Wall Street Journal reported that, as a result of continued U.S.-China trade talks, firms with at least 25-percent Chinese ownership will be barred from purchasing U.S. companies with “industrially significant technology.” The White House countered this claim, saying that it would expand the authority of the Committee on Foreign Investment in the United States rather than apply new investment restrictions.
• The spread between the 2-year and 10-year Treasury notes reached 30 bps, the narrowest it’s been since 2007. As a result, defensive sectors—REITs, utilities, and telecom—posted the strongest performance. The industrials, health care, and consumer discretionary sectors were the worst performers, as investors moved away from growth stocks.
• Last week saw the release of a number of important data points. On Monday, new home sales beat expectations, growing by 6.7 percent against expectations for more modest 0.8-percent growth.
• On Tuesday, the Conference Board Consumer Confidence Index declined modestly yet remained near multiyear highs. On Wednesday, durable goods orders dropped by 0.8 percent for the month, as a 7-percent decline in automobile orders dragged down growth.
• On Thursday, the third and final measure of first-quarter gross domestic product (GDP) growth came in at 2 percent. This was down from the previous estimate of 2.2 percent. Second-quarter growth, however, is expected to increase meaningfully.
• Finally, on Friday, personal income and spending in May both grew, by 0.4 percent and 0.2 percent, respectively. This should help drive overall second-quarter GDP growth.


Equity Index Week-to-Date Month-to-Date Year-to-Date 12-Month
S&P 500 –0.87% 1.95% 4.00% 15.38%
Nasdaq Composite –0.68% 3.42% 12.02% 24.71%
DJIA –2.03% 0.78% 0.54% 17.53%
MSCI EAFE –0.95% –0.16% –1.38% 8.44%
MSCI Emerging Markets –2.26% –2.72% –5.22% 10.60%
Russell 2000 0.11% 3.26% 10.39% 21.54%

Source: Bloomberg


Fixed Income Index Month-to-Date Year-to-Date 12-Month
U.S. Broad Market –0.12% –1.62% –0.40%
U.S. Treasury 0.02% –1.08% –0.65%
U.S. Mortgages 0.05% –0.95% 0.15%
Municipal Bond 0.09% –0.25% 1.56%

Source: Morningstar Direct

What to look forward to
This week will be a very busy one, with a number of reports covering all aspects of the economy.

On Monday, the Institute for Supply Management (ISM) Manufacturing index will be released; it is expected to decline slightly from 58.7 in May to 58 in June. This is a diffusion index, where values above 50 indicate expansion. As such, the expected change would keep the index at a healthy level and should be positive for growth. The stronger U.S. dollar, which hurts manufacturers, as well as increasing trade conflicts may weigh on this result.

On Thursday, the ISM Nonmanufacturing index will be released; it also is expected to pull back slightly, from 58.6 in May to 58 in June. There may be some upside risk here, however, with retail sales and consumer spending doing well in response to tax cuts and high consumer confidence. As with the manufacturing index, even this slight pullback would leave the index at a healthy expansionary level.

Also on Thursday, the Federal Reserve will release the minutes from its June meeting. While there seemed to be a modest hawkish shift in the meeting statement, the minutes will provide insight into just how confident members are in their growth projections. The markets will be looking for details about the likely rate increases.

On Friday, the international trade report is expected to show a slight decline in the trade deficit from $46.2 billion in April to $45.4 billion in May. The deficit in traded goods declined significantly on strong export growth last month, so there may be potential for a positive surprise. If so, net exports could contribute meaningfully to second-quarter growth.

Also on Friday, the employment report is expected to show a decrease in job growth from 223,000 in May to a still strong 198,000 in June. Unemployment is expected to stay steady at 3.8 percent—the lowest level in decades. Growth in average earnings is also expected to remain solid at a healthy 0.3 percent, which would take the annual rate back up to 2.8 percent. While there may be some downside risk to the job creation numbers, if the report comes even close to expectations, it will mean good things for continued economic growth.

Disclosures: Certain sections of this commentary contain forward-looking statements that are based on our reasonable expectations, estimates, projections, and assumptions. Forward-looking statements are not guarantees of future performance and involve certain risks and uncertainties, which are difficult to predict. All indices are unmanaged and are not available for direct investment by the public. Past performance is not indicative of future results. The S&P 500 is based on the average performance of the 500 industrial stocks monitored by Standard & Poor’s. The Nasdaq Composite Index measures the performance of all issues listed in the Nasdaq Stock Market, except for rights, warrants, units, and convertible debentures. The Dow Jones Industrial Average is computed by summing the prices of the stocks of 30 large companies and then dividing that total by an adjusted value, one which has been adjusted over the years to account for the effects of stock splits on the prices of the 30 companies. Dividends are reinvested to reflect the actual performance of the underlying securities. The MSCI EAFE Index is a float-adjusted market capitalization index designed to measure developed market equity performance, excluding the U.S. and Canada. The MSCI Emerging Markets Index is a market capitalization-weighted index composed of companies representative of the market structure of 26 emerging market countries in Europe, Latin America, and the Pacific Basin. The Russell 2000® Index measures the performance of the 2,000 smallest companies in the Russell 3000® Index. The Bloomberg Barclays US Aggregate Bond Index is an unmanaged market value-weighted performance benchmark for investment-grade fixed-rate debt issues, including government, corporate, asset-backed, and mortgage-backed securities with maturities of at least one year. The U.S. Treasury Index is based on the auctions of U.S. Treasury bills, or on the U.S. Treasury’s daily yield curve. The Bloomberg Barclays US Mortgage Backed Securities (MBS) Index is an unmanaged market value-weighted index of 15- and 30-year fixed-rate securities backed by mortgage pools of the Government National Mortgage Association (GNMA), Federal National Mortgage Association (Fannie Mae), and the Federal Home Loan Mortgage Corporation (FHLMC), and balloon mortgages with fixed-rate coupons. The Bloomberg Barclays US Municipal Index includes investment-grade, tax-exempt, and fixed-rate bonds with long-term maturities (greater than 2 years) selected from issues larger than $50 million.

Mark Gallagher is a financial advisor located at Gallagher Financial Services at 2586 East 7th Ave. Suite #304, North Saint Paul, MN 55109. He offers securities and advisory services as an Investment Adviser Representative of Commonwealth Financial Network®, Member FINRA/SIPC, a Registered Investment Adviser. He can be reached at 651-774-8759 or at mark@markgallagher.com

Authored by the Investment Research team at Commonwealth Financial Network.

© 2018 Commonwealth Financial Network®