Presented by Mark Gallagher
General market news
• The yield on the 10-year Treasury opened at 2.23 percent early Tuesday after the long weekend, in line with where it opened last Monday. It seems that downward pressure has taken over in the last two weeks, as the 10-year yield hovers around 2.23 percent and has not been above 2.30 percent since May 17. The yield on the 30-year Treasury opened at 2.90 percent early Tuesday and has not been over 3 percent in two weeks.
• The theme of the week was “no news is good news,” as a break from political uncertainty in the headlines and continued positive earnings data helped lift all three major U.S. indices. In contrast with the previous week’s political concerns in the U.S. and Brazil, this week moved closer to the end of the earnings season and news of an upward revision in the Q1 gross domestic product (GDP) number. As of the end of the week, 477 of the S&P 500 companies had reported for Q1, and earnings are expected to increase 15.3 percent compared with Q1 2016. Looking at the ex-energy numbers, earnings are still expected to rise by 11 percent. Economic news was positive both here and in Europe. The second estimate of the Q1 2017 GDP number saw a revision from 0.7 to 1.2 percent growth, and the Purchasing Managers’ Index for the eurozone stayed at a six-year high. Finally, Moody’s downgraded China’s credit rating to A1, citing rising liabilities and weakening financial strength. Equity markets did not see much reaction to the news.
• Last week’s economic data saw mixed results. The week started on somewhat of a disappointing note, as both new homes and existing home sales came in below estimates. Specifically, new homes saw a decline of 11.4 percent month-over-month. Much of this slowdown can be attributed to lack of inventory. Durable goods orders for April were also lower than expected, as both headline and core figures were down month-over-month. This disappointing data indicates that increased business investment is unlikely to be a large driver of Q2 GDP growth and may even prove to be a slight headwind.
• On a brighter note, the second estimate for Q1 GDP growth surprised by increasing to 1.2 percent against expectations for a decline of 0.7 percent. This growth was largely attributed to increases in personal consumption and business investment, two areas that had shown notable weakness in initial estimates.
| Equity Index | Week-to-Date | Month-to-Date | Year-to-Date | 12-Month |
| S&P 500 | 1.47% | 1.54% | 8.81% | 18.03% |
| Nasdaq Composite | 2.10% | 2.89% | 15.97% | 28.31% |
| DJIA | 1.35% | 1.00% | 7.78% | 21.29% |
| MSCI EAFE | 0.21% | 3.44% | 14.04% | 16.62% |
| MSCI Emerging Markets | 2.18% | 4.14% | 18.66% | 30.11% |
| Russell 2000 | 1.11% | –1.20% | 2.34% | 22.99% |
Source: Bloomberg
| Fixed Income Index | Month-to-Date | Year-to-Date | 12-Month |
| U.S. Broad Market | 0.47% | 2.08% | 1.33% |
| U.S. Treasury | 0.33% | 1.71% | –0.27% |
| U.S. Mortgages | 0.41% | 1.54% | 0.99% |
| Municipal Bond | 1.28% | 3.62% | 1.22% |
Source: Morningstar Direct
What to look forward to
We’ll get quite a bit of data in the week ahead, providing a good picture of whether the economy is accelerating—or not.
On Tuesday, personal income is expected to grow by 0.4 percent for April, up from 0.2 percent for March, on continued job and wage growth. Personal spending growth should also accelerate, from flat in March to 0.4 percent in April, as auto sales rebound. If these numbers come in as expected, this would be positive and suggest that consumers are spending again after a slow winter.
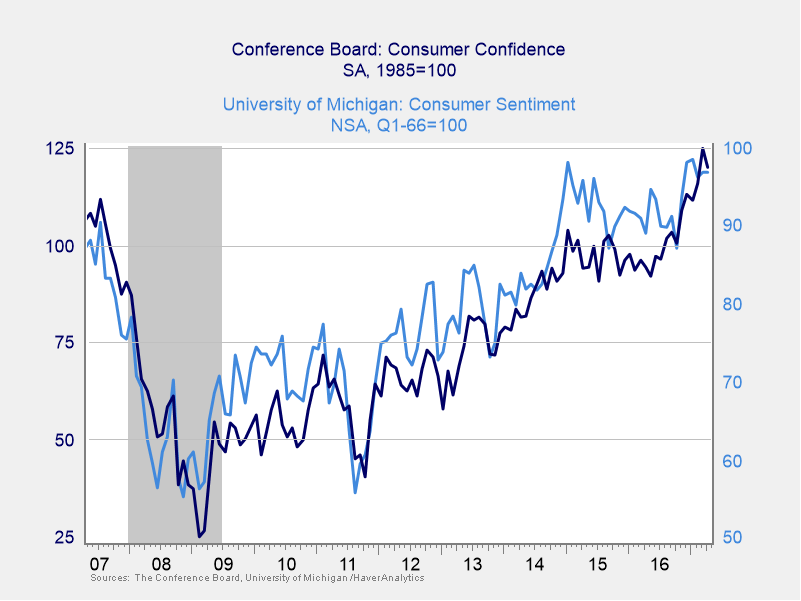
Also on Tuesday, the Conference Board Consumer Confidence Survey will give us a more forward-looking view of the consumer. Confidence is expected to decline slightly, from 120.3 to 119.9. This would still be close to a 16-year high and indicate an expanding economy.
On Thursday, the ISM Manufacturing Index is expected to drop back slightly as well, from 54.8 to 54.6. Again, this would leave it securely in expansion territory but suggest further acceleration is still to come. While U.S. manufacturing has benefited from higher global trade growth, that now appears to be slowing.
This trend should also be apparent in the international trade report, due on Friday, which is expected to show a small increase in the trade deficit, from $43.7 billion to $44.0 billion. There is downside risk to this report, however, on a rise in imports and a drop in manufactured exports. If so, trade will most likely be a drag on economic growth in the second quarter.
Finally, on Friday, the jobs report is expected to show an increase in jobs of 176,000 in May, which is a healthy level but down from 211,000 in April. The unemployment rate is expected to remain constant, at a low 4.4 percent, and wage growth to remain at 0.3 percent. Should this report meet expectations, it would indicate a continued trend in growth but, again, no acceleration.
Disclosures: Certain sections of this commentary contain forward-looking statements that are based on our reasonable expectations, estimates, projections, and assumptions. Forward-looking statements are not guarantees of future performance and involve certain risks and uncertainties, which are difficult to predict. All indices are unmanaged and are not available for direct investment by the public. Past performance is not indicative of future results. The S&P 500 is based on the average performance of the 500 industrial stocks monitored by Standard & Poor’s. The Nasdaq Composite Index measures the performance of all issues listed in the Nasdaq Stock Market, except for rights, warrants, units, and convertible debentures. The Dow Jones Industrial Average is computed by summing the prices of the stocks of 30 large companies and then dividing that total by an adjusted value, one which has been adjusted over the years to account for the effects of stock splits on the prices of the 30 companies. Dividends are reinvested to reflect the actual performance of the underlying securities. The MSCI EAFE Index is a float-adjusted market capitalization index designed to measure developed market equity performance, excluding the U.S. and Canada. The MSCI Emerging Markets Index is a market capitalization-weighted index composed of companies representative of the market structure of 26 emerging market countries in Europe, Latin America, and the Pacific Basin. The Russell 2000® Index measures the performance of the 2,000 smallest companies in the Russell 3000® Index. The Bloomberg Barclays US Aggregate Bond Index is an unmanaged market value-weighted performance benchmark for investment-grade fixed-rate debt issues, including government, corporate, asset-backed, and mortgage-backed securities with maturities of at least one year. The U.S. Treasury Index is based on the auctions of U.S. Treasury bills, or on the U.S. Treasury’s daily yield curve. The Bloomberg Barclays US Mortgage Backed Securities (MBS) Index is an unmanaged market value-weighted index of 15- and 30-year fixed-rate securities backed by mortgage pools of the Government National Mortgage Association (GNMA), Federal National Mortgage Association (Fannie Mae), and the Federal Home Loan Mortgage Corporation (FHLMC), and balloon mortgages with fixed-rate coupons. The Bloomberg Barclays US Municipal Index includes investment-grade, tax-exempt, and fixed-rate bonds with long-term maturities (greater than 2 years) selected from issues larger than $50 million.
Mark Gallagher is a financial advisor located at Gallagher Financial Services at 2586 East 7th Ave. Suite #304, North Saint Paul, MN 55109. He offers securities and advisory services as an Investment Adviser Representative of Commonwealth Financial Network®, Member FINRA/SIPC, a Registered Investment Adviser. He can be reached at 651-774-8759 or at mark@markgallagher.com.
Authored by the Investment Research team at Commonwealth Financial Network.
© 2017 Commonwealth Financial Network®