Presented by Mark Gallagher
General market news
• The yield on the 10-year Treasury dropped to 1.53 percent late last week, the lowest level since the summer of 2012, but opened at 1.75 percent early Tuesday morning. The 30-year Treasury yield was as low as 2.46 percent last week before opening at 2.60 percent Tuesday morning.
• Equities sold off last week, and performance would have been much worse if not for a rally on Friday. Domestic markets fared better than international markets, which were closed in the midst of the U.S. rally. International markets rebounded strongly on Monday, however, while U.S. markets were closed for the Presidents’ Day holiday.
• Oil prices bounced back last week. Over the weekend, news of a possible agreement to freeze production by major exporters, including Russia and Saudi Arabia, offered potential for further price inflation, but the plan could unravel without support from other OPEC nations.
| Equity Index | Week-to-Date | Month-to-Date | Year-to-Date | 12-Month |
| S&P 500 | −0.72% | −3.74% | −8.51% | −8.80% |
| Nasdaq Composite | −0.56% | −5.89% | −13.25% | −9.59% |
| DJIA | −1.23% | −2.75% | −7.99% | −8.90% |
| MSCI EAFE | −4.71% | −6.15% | −12.92% | −15.51% |
| MSCI Emerging Markets | −3.83% | −4.17% | −10.39% | −24.77% |
| Russell 2000 | −1.34% | −6.06% | −14.32% | −18.96% |
Source: Bloomberg
| Fixed Income Index | Month-to-Date | Year-to-Date | 12-Month |
| U.S. Broad Market | 0.40% | 1.78% | 1.50% |
| U.S. Treasury | 0.98% | 3.13% | 3.17% |
| U.S. Mortgages | 0.16% | 1.46% | 2.43% |
| Municipal Bond | 0.60% | 1.80% | 4.47% |
Source: Morningstar Direct
What to look forward to
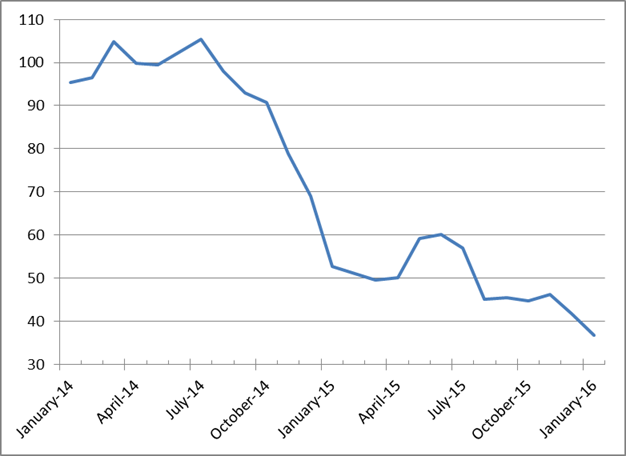
During this holiday-shortened week, we will receive important data on both the housing market and inflation.
On Wednesday, economists are expecting to see an uptick in Housing Starts and an increase in Building Permits.
On the inflation front, both headline and core numbers for the Producer Price Index will be reported on Wednesday, and a slight pickup is expected.
Friday will bring headline and core readings for the Consumer Price Index, where an uptick is also expected.
Disclosures: Certain sections of this commentary contain forward-looking statements that are based on our reasonable expectations, estimates, projections, and assumptions. Forward-looking statements are not guarantees of future performance and involve certain risks and uncertainties, which are difficult to predict. All indices are unmanaged and are not available for direct investment by the public. Past performance is not indicative of future results. The S&P 500 is based on the average performance of the 500 industrial stocks monitored by Standard & Poor’s. The Nasdaq Composite Index measures the performance of all issues listed in the Nasdaq Stock Market, except for rights, warrants, units, and convertible debentures. The Dow Jones Industrial Average is computed by summing the prices of the stocks of 30 large companies and then dividing that total by an adjusted value, one which has been adjusted over the years to account for the effects of stock splits on the prices of the 30 companies. Dividends are reinvested to reflect the actual performance of the underlying securities. The MSCI EAFE Index is a float-adjusted market capitalization index designed to measure developed market equity performance, excluding the U.S. and Canada. The MSCI Emerging Markets Index is a market capitalization-weighted index composed of companies representative of the market structure of 26 emerging market countries in Europe, Latin America, and the Pacific Basin. The Russell 2000® Index measures the performance of the 2,000 smallest companies in the Russell 3000® Index. The Barclays Capital Aggregate Bond Index is an unmanaged market value-weighted performance benchmark for investment-grade fixed-rate debt issues, including government, corporate, asset-backed, and mortgage-backed securities with maturities of at least one year. The U.S. Treasury Index is based on the auctions of U.S. Treasury bills, or on the U.S. Treasury’s daily yield curve. The Barclays Capital Mortgage-Backed Securities (MBS) Index is an unmanaged market value-weighted index of 15- and 30-year fixed-rate securities backed by mortgage pools of the Government National Mortgage Association (GNMA), Federal National Mortgage Association (Fannie Mae), and the Federal Home Loan Mortgage Corporation (FHLMC), and balloon mortgages with fixed-rate coupons. The Barclays Capital Municipal Bond Index includes investment-grade, tax-exempt, and fixed-rate bonds with long-term maturities (greater than 2 years) selected from issues larger than $50 million. The Barclays Capital U.S. Treasury Inflation Protected Securities (TIPS) Index measures the performance of intermediate (1- to 10-year) U.S. TIPS.
Mark Gallagher is a financial advisor located at Gallagher Financial Services at 2586 East 7th Ave, North Saint Paul, MN 55109. He offers securities and advisory services as an Investment Adviser Representative of Commonwealth Financial Network®, Member FINRA/SIPC, a Registered Investment Adviser. He can be reached at 651-774-8759 or at mark@markgallagher.com.
Authored by the Investment Research team at Commonwealth Financial Network.
© 2016 Commonwealth Financial Network®