Presented by Mark Gallagher
For U.S. markets, a weak September blunts quarterly gains
September was a weak month for U.S. markets, with the Dow Jones Industrial Average posting a small loss of 0.23 percent; the S&P 500 Index declining further, down 1.40 percent; and the Nasdaq dropping 1.90 percent. All three indices bounced around breakeven levels throughout most of the month before finally declining in the last week.
For the quarter, September reversed most of the gains of July and August. In fact, although all three indices were up for the three-month period—the Dow up 1.87 percent, the S&P 500 up 1.13 percent, and the Nasdaq up 1.93 percent—September’s losses cut the gains at least in half.
The month’s weakness was driven by both fundamental and technical factors. Per FactSet, at September’s end, the estimated earnings growth rate for the third quarter was 4.7 percent—almost half the estimated growth rate of 8.9 percent at the start of the quarter. Nine of 10 sectors now have lower expected earnings growth—the exception being health care. The decline in earnings growth expectations no doubt was a negative factor during the month.
Technical factors that led to weakness included the S&P 500’s approach to the 2,000 level. Historically, the stock market has either moved strongly through major breakpoints or hesitated and dropped, and the S&P 500 has had a difficult time cracking 2,000.
Another sign of technical weakness, gains in the indices have been increasingly driven by gains in the share prices of larger companies. Smaller companies underperformed for both the month and the quarter, suggesting that investors have become increasingly risk-averse, which is a poor foundation for a sustained advance. This performance differential has also led to diversified portfolios underperforming the indices.
Large blue-chip companies, as represented by the S&P 500, have materially outperformed small-cap companies on the Russell 2000 Index for the year (see chart). Traditionally, in times of market strength, investors expect small companies to grow their earnings at faster rates than large companies. Thus, the Russell 2000 often outperforms the S&P 500 in bull markets, as investors bid up prices for the more rapidly growing small companies. This relationship held in 2013 and in the beginning of 2014, as small-cap stocks outperformed large-caps. Since March, however, large-caps have dramatically outperformed. Historically, when large-caps have outpaced small-caps, future performance for large-caps has been diminished, as valuations revert to the mean.
Price History, S&P 500 (Large-Caps) and Russell 2000 (Small-Caps) Indices, January 2013–September 2014
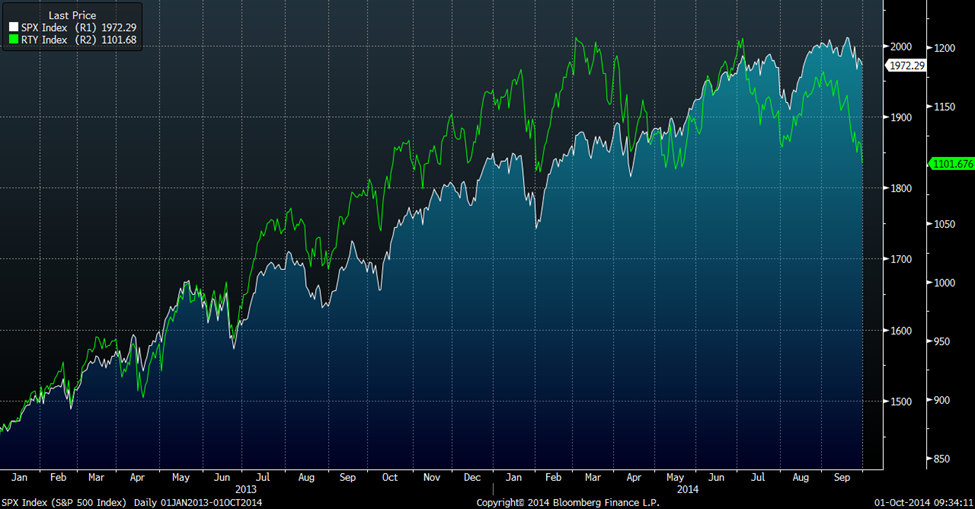
Source: Bloomberg
International markets suffered much more than U.S. markets. The MSCI EAFE Index continued its weak performance of three down months in a row, with a decline of 3.84 percent for September, on growing political and economic worries in Europe and the United Kingdom. The referendum in Scotland on independence from the U.K. rattled markets earlier in the month, while continuing poor news in the progress of a German court case that could declare intervention by the European Central Bank as illegal concerned them toward month-end. Finally, the ongoing conflict between Russia and Ukraine, as well as sanctions imposed on Russia, continued to do economic damage throughout the continent. For the quarter, the EAFE was the worst-performing major index, losing 5.88 percent.
Emerging markets suffered as well, with the MSCI Emerging Markets Index down a significant 7.59 percent for the month. In addition to the troubles in Europe, China’s growth continued to slow, with housing prices actually decreasing in many cities and the government refusing to step in with stimulus, as it had in the past. Just as with the U.S. indices, the drop in September reversed gains for the previous two months; in this instance, however, the decline led to a quarterly loss of 4.33 percent.
Fixed income also suffered for the month, with the Barclays Capital Aggregate Bond Index down 0.68 percent, which took the quarter to a small gain of 0.17 percent. Declines were driven by an increase in interest rates in September, with the 10-year U.S. Treasury bond yield rising from 2.35 percent to 2.52 percent. For the quarter, rates were relatively stable, with the 10-year U.S. Treasury dropping slightly, from 2.53 percent at the start of the period to 2.52 percent at the end.
U.S. economy continues to do well
Good news for the U.S. economy continued in September. Positive data points included rising auto sales and home prices, as well as a double-digit drop in job cuts and the nonmanufacturing business survey hitting a nine-year high. Although news from the housing market was somewhat mixed, strong new home sales and continued price rises provided positive support for the economy. Both retail sales and consumer confidence rose strongly. Another positive factor was the upward revision of economic growth, to 4.6 percent from 4.2 percent, for the previous quarter, which provided further support for growing recovery momentum.
The weak part of the month was employment. Job gains were well below expectations, at 142,000, far from the 200,000-plus levels of recent months. At the same time, other employment metrics were strong, suggesting that weak job gains would likely rise again. In addition, jobless claims remained at low levels, one measure of job cuts declined 20 percent, and companies’ hiring intentions stayed strong. Altogether, this suggests that employment continues to grow, but it does inject a note of caution.
Despite the weak jobs number, the Federal Reserve ratified the ongoing recovery by deciding to further reduce its bond purchases to $15 billion a month. It also indicated that it expected to stop the purchases in October, data permitting, which would remove the Fed from the economy for the first time in years. The anticipated end of stimulus, along with an upward revision of the Fed’s estimate of future interest rates, likely contributed to September’s rise in rates.
Geopolitical turbulence hits markets
The big international story of the month was the Scottish independence referendum. Although Scotland voted down independence, the very real possibility that it might have seceded from the U.K. led markets to consider the possibility that other areas could be affected. Rising uncertainty drove equity prices down, even as European interest rates remained low, kept there by government and central bank action that was driven by continued weak economic growth and high unemployment. The weak growth, or actual decline, has led to growing political strains and anti-euro parties gaining seats in national parliaments. This trend, along with the Scottish referendum, raised the possibility that, if Great Britain could break up, perhaps the eurozone could as well.
Another messy potential breakup, this one fought with guns instead of slogans, continued in Ukraine, where government and rebel forces fought sporadically despite a cease-fire. As talks went on, the prospect of disruption in gas supplies to Europe, combined with economic damage from sanctions, hit the European economy even harder.
Oil prices decline despite ISIS
Despite all the turmoil, especially in the Middle East, oil prices declined slightly for the month and substantially for the quarter. The Brent Crude price dropped 5.68 percent in September and 14.10 percent for the quarter, while the price for West Texas Intermediate dropped 6.53 percent for the month and 13.77 percent for the quarter. Price declines were due both to a drop in demand—as China’s and Europe’s growth slowed—and an increase in supply from the U.S. and other countries. The U.S., expected to become the world’s largest oil producer shortly (if it hasn’t already), is moving into a price-setting position, which should help moderate oil prices in the future. This will likely be good for the U.S. economy in multiple ways.
Investors pull back as risks rise
September is historically a difficult month, and that has been the case this year, particularly in international markets. Although the U.S. has suffered relatively little damage so far, we are exposed to growing geopolitical and economic turbulence. As Europe and China adjust to lower growth rates, and Russia and Ukraine sort out their differences, the U.S. recovery will very likely continue but at a slower pace. Markets can be expected to adjust to lower growth rates, and companies can be expected to adjust their expectations based on conditions in the rest of the world.
Although market price adjustments are never pleasant, they are an inevitable result of investors adjusting risk exposures and in the long term are usually not significant. Investors with properly diversified portfolios have enjoyed the market run-up in the past several years and should be prepared to take an inevitable downturn in stride.
On balance, more turbulence looks quite possible; however, the U.S. remains exceptionally well positioned for the future, and U.S. investors should continue to participate in the growth.
All information according to Bloomberg, unless stated otherwise.
Disclosure: Certain sections of this commentary contain forward-looking statements that are based on our reasonable expectations, estimates, projections, and assumptions. Forward-looking statements are not guarantees of future performance and involve certain risks and uncertainties, which are difficult to predict. Past performance is not indicative of future results. Diversification does not assure a profit or protect against loss in declining markets. All indices are unmanaged and investors cannot invest directly into an index. The Dow Jones Industrial Average is a price-weighted average of 30 actively traded blue-chip stocks. The S&P 500 Index is a broad-based measurement of changes in stock market conditions based on the average performance of 500 widely held common stocks. The Nasdaq Composite Index measures the performance of all issues listed in the Nasdaq Stock Market, except for rights, warrants, units, and convertible debentures. The Russell 2000® Index measures the performance of the 2,000 smallest companies in the Russell 3000 Index. The MSCI EAFE Index is a float-adjusted market capitalization index designed to measure developed market equity performance, excluding the U.S. and Canada. The MSCI Emerging Markets Index is a market capitalization-weighted index composed of companies representative of the market structure of 26 emerging market countries in Europe, Latin America, and the Pacific Basin. It excludes closed markets and those shares in otherwise free markets that are not purchasable by foreigners. The Barclays Capital Aggregate Bond Index is an unmanaged market value-weighted index representing securities that are SEC-registered, taxable, and dollar-denominated. It covers the U.S. investment-grade fixed-rate bond market, with index components for a combination of the Barclays Capital government and corporate securities, mortgage-backed pass-through securities, and asset-backed securities.
###
Mark Gallagher is a financial advisor located at Gallagher Financial Services at 2586 East 7th Avenue, North Saint Paul, MN 55109. He offers securities and advisory services as an Investment Adviser Representative of Commonwealth Financial Network®, Member FINRA/SIPC, a Registered Investment Adviser. He can be reached at 651-774-8759 or at mark@markgallagher.com
Authored by Brad McMillan, vice president, chief investment officer, at Commonwealth Financial Network.
© 2014 Commonwealth Financial Network®